Signal and spectrum analyzers are indispensable tools in the field of electronics and telecommunications. They play a crucial role in analyzing and understanding the behavior of various signals, whether it’s in research and development, manufacturing, or troubleshooting complex systems. In this blog post, we’ll delve into the world of signal and spectrum analyzers, exploring their fundamental principles, applications, and key features.

Understanding Signal Analyzers:
Signal analyzers are instruments used to measure, display, and analyze the characteristics of electrical signals. They offer insights into various parameters such as frequency, amplitude, phase, distortion, modulation, and more. By capturing and processing signals, signal analyzers provide valuable information for engineers and technicians to evaluate, validate, and troubleshoot electronic systems. Spectrum analyzers, a subset of signal analyzers, focus on the frequency domain of signals. They enable engineers to view signal strength as a function of frequency, allowing for a comprehensive analysis of spectral components. Spectrum analyzers provide vital information about frequency distribution, harmonics, noise, and spurious signals. Buy Calibrated, new or used Signal and Spectrum Analyzer from your trusted partner Wyoming Electronics Inc.
Key Features and Functionality:
Frequency Range and Resolution:
Signal and spectrum analyzers come with different frequency range capabilities to accommodate a wide array of applications. Higher frequency ranges are essential for testing microwave and wireless systems. Additionally, the resolution bandwidth determines the level of detail captured by the analyzer.
Dynamic Range and Sensitivity:
The dynamic range of an analyzer refers to its ability to distinguish between low and high-level signals accurately. A high dynamic range ensures the detection of weak signals in the presence of stronger ones. Sensitivity, on the other hand, represents the minimum signal level that the analyzer can reliably detect.
Modulation Analysis:
Signal analyzers equipped with modulation analysis capabilities are invaluable in characterizing modulated signals. They allow engineers to analyze parameters such as modulation depth, carrier frequency, and modulation schemes like amplitude modulation (AM), frequency modulation (FM), and phase modulation (PM).
Real-Time Analysis:
Some advanced signal and spectrum analyzers provide real-time analysis capabilities, enabling engineers to capture and analyze signals in the time domain. Real-time analyzers are particularly useful for troubleshooting intermittent issues, transient analysis, and capturing burst signals.
Integration and Connectivity:
Modern signal and spectrum analyzers offer seamless integration with computer systems, enabling data transfer, remote control, and advanced analysis through software interfaces. Connectivity options such as Ethernet, USB, GPIB, and wireless interfaces enhance usability and workflow efficiency.
Applications in Various Industries:
a. Telecommunications: Analyzing and optimizing wireless communication systems, testing base stations, and evaluating signal quality.
b. Electronics Manufacturing: Verifying performance, debugging designs, and conducting quality assurance tests.
c. Aerospace and Defense: Evaluating radar and communication systems, performing spectrum monitoring, and conducting electromagnetic compatibility (EMC) testing.
d. Audio and Acoustics: Analyzing sound and vibration signals, evaluating audio equipment performance, and conducting noise measurements.
e. Medical and Life Sciences: Examining physiological signals, testing medical devices, and analyzing bioelectric activity.
How does it work?
Let’s dive into a more detailed explanation of how a signal and spectrum analyzer works:
Signal Input and Pre-Amplification:
The signal to be analyzed is connected to the input port of the analyzer. The input can be in the form of voltage, current, or electromagnetic waves, depending on the type of signal being measured. In some cases, a pre-amplifier may be used to boost weak signals or attenuators to reduce strong signals to a measurable range.
Analog-to-Digital Conversion (ADC):
The analog signal is then converted into a digital format using an analog-to-digital converter (ADC). The ADC samples the continuous analog waveform at regular intervals, converting the voltage levels into discrete digital values. The sampling rate determines the number of samples taken per second, and the resolution determines the number of bits used to represent each sample.
Signal Processing and Fast Fourier Transform (FFT):
Once the signal is digitized, it undergoes signal processing algorithms, typically employing the Fast Fourier Transform (FFT) algorithm. The FFT converts the time-domain signal into the frequency domain by decomposing it into its constituent sinusoidal components. This transformation provides a spectrum that represents the signal’s frequency content.
Windowing:
Before applying the FFT, a windowing function may be applied to the sampled data to reduce the spectral leakage effect. Spectral leakage occurs due to discontinuities at the beginning and end of the signal segment being analyzed. Windowing functions, such as the Hanning or Hamming window, taper the signal to reduce these effects.
Spectrum Analysis and Display:
The FFT output provides the amplitude and phase information for each frequency component present in the signal. This information is plotted on a frequency axis, typically displayed as a graph or a spectrogram. The amplitude represents the signal strength at each frequency, and the phase represents the relative timing of the signal components.
Measurement and Analysis:
Signal and spectrum analyzers offer a range of measurement capabilities for analyzing the signal. This includes features such as peak detection, average power measurement, modulation analysis, distortion measurement, noise figure measurement, and more. These measurements help engineers assess the signal’s characteristics, validate system performance, and diagnose issues.
Display and User Interface:
Signal and spectrum analyzers provide a user-friendly interface to visualize and interpret the measured data. The display can show a variety of views, including time-domain waveforms, frequency spectra, spectrograms, and other relevant parameters. Users can interact with the analyzer, adjust settings, zoom in on specific regions of interest, and perform detailed analysis.
Connectivity and Control:
Modern signal and spectrum analyzers often come with various connectivity options such as USB, Ethernet, GPIB, or wireless interfaces. These interfaces allow the analyzer to be connected to a computer or network, enabling data transfer, remote control, and integration with software tools for further analysis or automation.
How to use?
Using a signal and spectrum analyzer involves several steps to effectively analyze and measure signals. Here’s a guide on how to use a signal and spectrum analyzer:
Set Up the Analyzer:
a. Ensure the analyzer is properly connected to the power source and any necessary external devices.
b. Connect the signal source to the input of the analyzer using appropriate probes, cables, or antennas.
c. Verify that the analyzer is calibrated and any necessary adjustments, such as zeroing, have been performed.
Configure the Analyzer Settings:
a. Select the desired measurement mode (e.g., spectrum analysis, time-domain analysis, modulation analysis).
b. Set the frequency range and resolution bandwidth to match the characteristics of the signal being analyzed.
c. Choose the appropriate measurement parameters based on the specific analysis requirements (e.g., frequency, amplitude, modulation depth).
d. Adjust the display settings, such as scale, reference levels, and sweep time, to optimize the visibility of the signal.
Signal Acquisition:
a. Trigger the analyzer to start capturing the signal. Depending on the analyzer’s capabilities, this can be done manually or through an automated triggering mechanism.
b. Ensure that the signal being measured is stable and consistent during the acquisition process to obtain accurate results.
Signal Analysis and Measurement:
a. View the acquired signal on the analyzer’s display. This can be in the form of a time-domain waveform, frequency spectrum, or other relevant representations.
b. Use the available tools and controls on the analyzer to perform specific measurements. This can include measuring frequency, amplitude, distortion, modulation depth, signal-to-noise ratio, and more.
c. Adjust the measurement parameters or settings as needed to capture specific aspects of the signal or obtain more detailed information.
Interpret and Analyze the Results:
a. Analyze the displayed signal or spectrum to understand its characteristics and behavior.
b. Interpret the measurement results to assess the performance of the signal source, validate system functionality, or troubleshoot any issues.
c. Compare the measured parameters against expected values or specifications to determine if the signal meets the desired requirements.
Save and Document the Results:
a. If necessary, save the acquired data, measurement results, or screenshots for further analysis or documentation purposes.
b. Record any relevant information, including settings, conditions, and observations, for future reference or troubleshooting.
Remember, the specific steps and procedures may vary depending on the model and manufacturer of the signal and spectrum analyzer. It’s crucial to consult the instrument’s user manual or documentation for detailed instructions and guidelines specific to your analyzer model.
Companies that offer:
Keysight Technologies:
Keysight Technologies is a leading manufacturer of electronic measurement instruments. They offer a comprehensive portfolio of signal and spectrum analyzers, including:
- Benchtop Signal and Spectrum Analyzers: Keysight’s benchtop analyzers cover a wide frequency range and offer advanced measurement capabilities suitable for various applications.
- Handheld Signal Analyzers: These portable analyzers are designed for field use and provide essential signal analysis functionalities in a compact form factor.
- Real-Time Spectrum Analyzers: Keysight’s real-time analyzers capture and analyze signals in the time domain, offering insights into transient and dynamic signal behavior.
Rohde & Schwarz:
Rohde & Schwarz is a renowned manufacturer of test and measurement equipment. They offer a diverse range of signal and spectrum analyzers, including:
- High-Performance Spectrum Analyzers: Rohde & Schwarz provides high-end spectrum analyzers with exceptional performance, wide frequency coverage, and advanced measurement capabilities.
- Signal and Spectrum Analyzers for EMC Testing: These analyzers are specifically designed for electromagnetic compatibility (EMC) testing, ensuring compliance with regulatory standards.
- Handheld Spectrum Analyzers: Rohde & Schwarz offers portable analyzers suitable for field use, providing a combination of flexibility and measurement accuracy.
Anritsu:
Anritsu is a leading provider of wireless test and measurement solutions. Their signal and spectrum analyzers include:
- Vector Signal Analyzers: Anritsu’s vector signal analyzers offer comprehensive measurement capabilities for analyzing complex modulation schemes and wireless communication systems.
- Spectrum Master: Anritsu’s Spectrum Master analyzers are designed for field use and provide spectrum analysis functionality in a handheld form factor.
- Site Master: Anritsu’s Site Master series includes cable and antenna analyzers that also incorporate spectrum analysis capabilities for comprehensive RF testing.
Tektronix:
Tektronix is a well-known manufacturer of test and measurement instruments. They offer a range of signal and spectrum analyzers, including:
- Real-Time Spectrum Analyzers: Tektronix provides real-time analyzers that capture and analyze signals in the time domain, enabling detailed analysis of dynamic and intermittent signals.
- Benchtop Signal and Spectrum Analyzers: Their benchtop analyzers offer a combination of performance, accuracy, and flexibility, making them suitable for various applications.
- USB Spectrum Analyzers: Tektronix offers compact and portable USB-based spectrum analyzers that provide basic spectrum analysis capabilities in a convenient form factor.
How to choose?
Choosing the right signal and spectrum analyzer requires careful consideration of several factors to ensure it meets your specific needs. Here are some key points to consider when selecting a signal and spectrum analyzer:
Frequency Range:
Determine the frequency range of the signals you need to analyze. Choose an analyzer that covers the frequency range of your application, including any future requirements. Consider whether you need an analyzer for RF signals, audio signals, or other specific frequency ranges.
Dynamic Range and Sensitivity:
Assess the dynamic range and sensitivity of the analyzer. The dynamic range indicates the ability to measure a wide range of signal amplitudes accurately. Higher dynamic range and sensitivity allow for better measurement accuracy and the ability to detect weaker signals.
Resolution Bandwidth (RBW):
Consider the RBW requirement for your application. RBW determines the analyzer’s ability to separate closely spaced frequency components. Select an analyzer with a suitable RBW range to capture the desired level of frequency detail. Know more about RBW!
Measurement Capabilities:
Evaluate the specific measurement capabilities you need for your application. This can include parameters such as frequency, amplitude, modulation analysis, phase noise, distortion, noise figure, and more. Ensure the analyzer offers the necessary measurement features for your intended analysis tasks.
Real-Time Analysis:
Determine if real-time analysis capability is required. Real-time analyzers capture and analyze signals in the time domain, providing insights into transient and dynamic signal behavior. If you need to analyze signals with rapidly changing characteristics, consider an analyzer with real-time capabilities.
Portability and Form Factor:
Assess whether portability is a requirement. If you need to perform field measurements or work in different locations, consider a portable or handheld analyzer. Benchtop models are generally more feature-rich and offer better performance but may lack portability.
Connectivity and Integration:
Consider the connectivity options and integration capabilities of the analyzer. Evaluate the available interfaces such as USB, Ethernet, GPIB, or wireless connectivity. Ensure compatibility with your existing test and measurement systems, software tools, and automation requirements.
Budget:
Determine your budget constraints. Signal and spectrum analyzers vary in price based on their performance, capabilities, and brand. Set a realistic budget and evaluate analyzers that offer the required features within your budget range.
Support and Documentation:
Consider the availability of technical support, warranty, and documentation from the manufacturer. Ensure the manufacturer provides reliable support, firmware updates, and access to application notes or documentation to help you effectively use and troubleshoot the analyzer.
User Interface and Ease of Use:
Evaluate the user interface and ease of operation. Look for analyzers with intuitive interfaces, clear displays, and user-friendly controls. Consider features such as touchscreen interfaces, customizable layouts, and menu structures that align with your preferences and workflow.
By considering these factors, you can narrow down your options and choose a signal and spectrum analyzer that best suits your specific application requirements and budget. It’s advisable to consult with technical experts or seek guidance from vendors to ensure you make an informed decision.


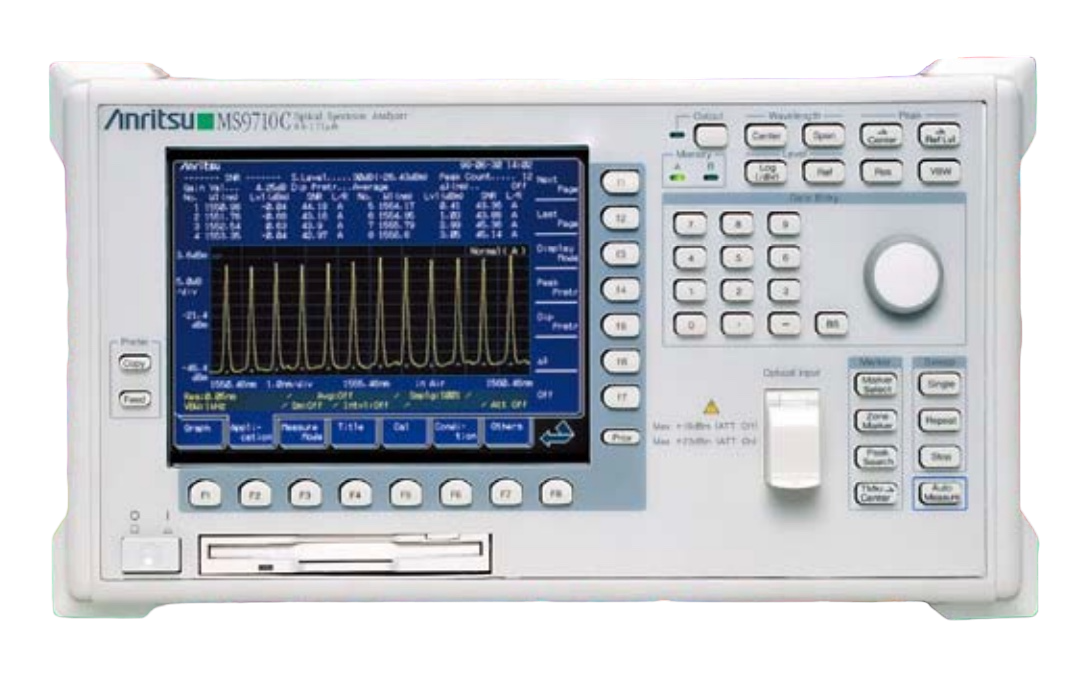 Spectrum Analyzers
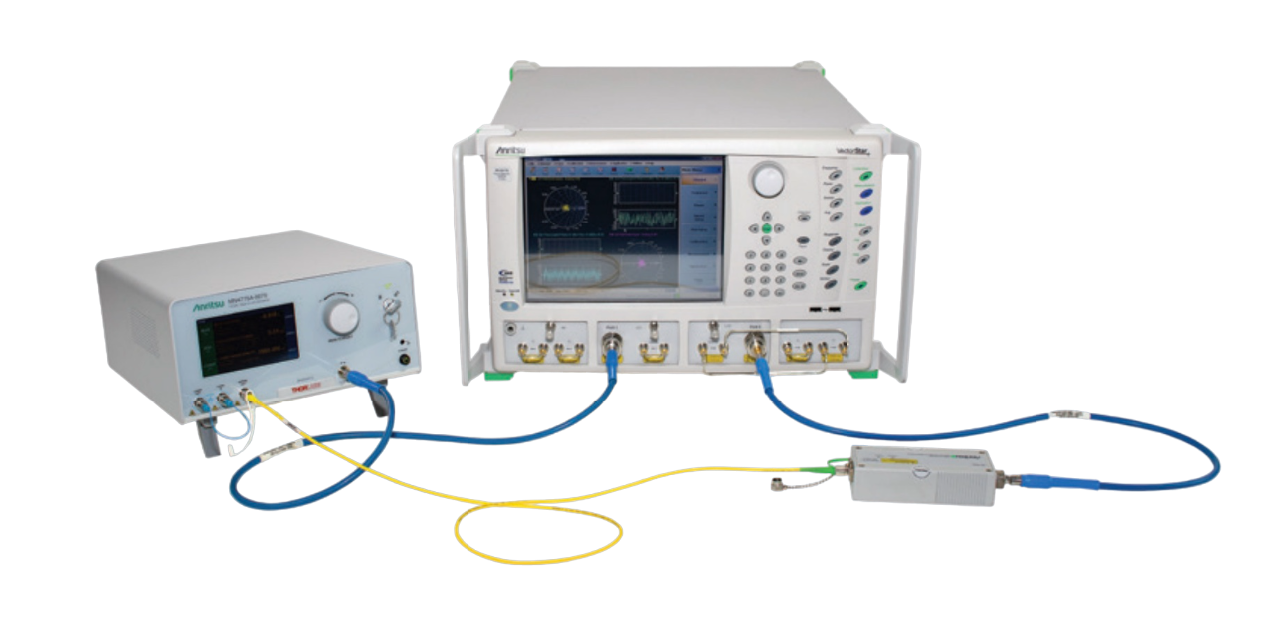 Network Analyzers
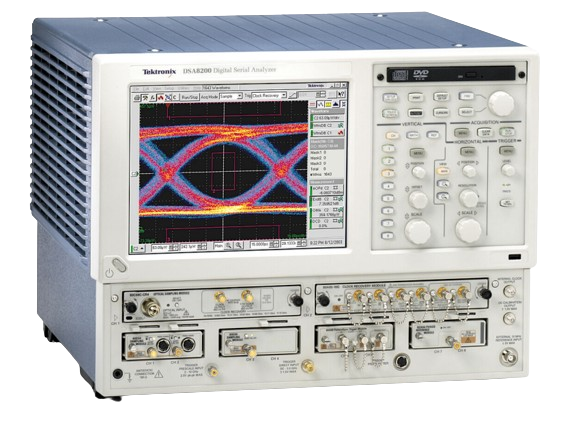 Signal Analyzers
 Logic Analyzers
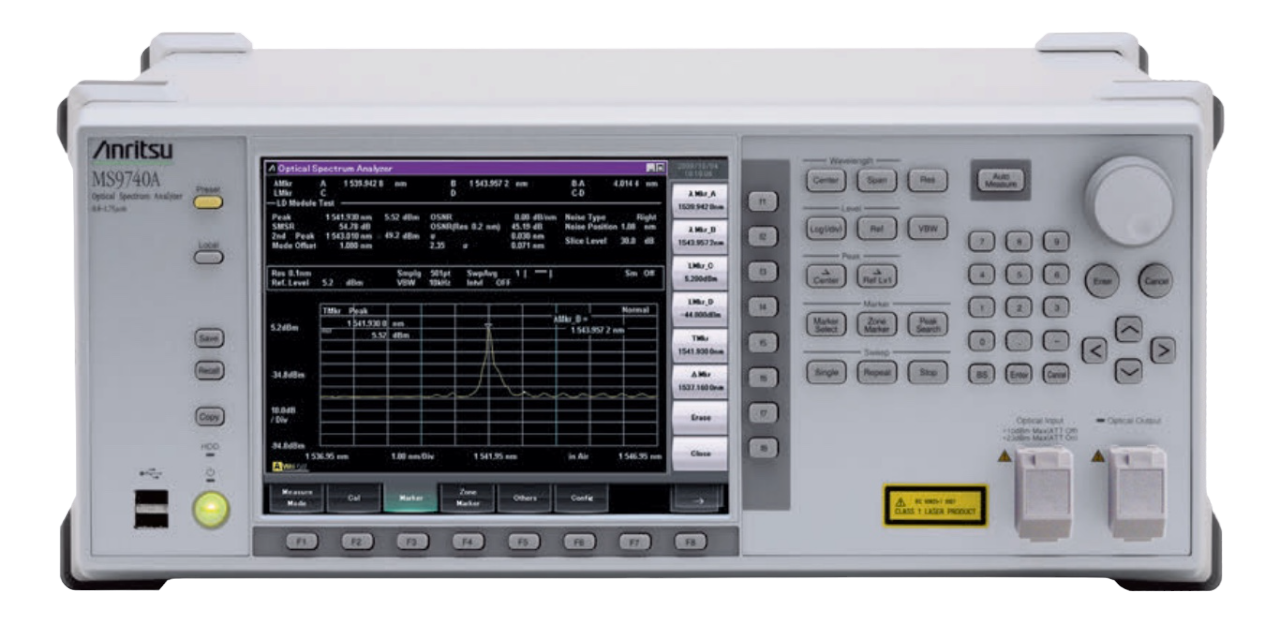 Optical Spectrum Analyzers
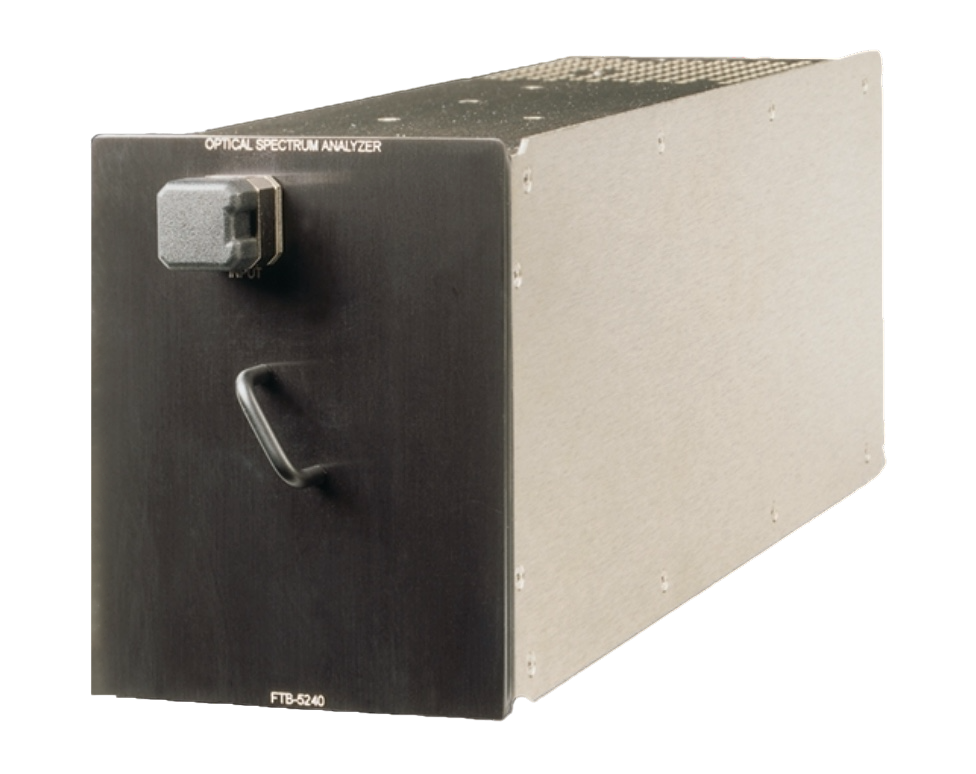 Other Analyzers
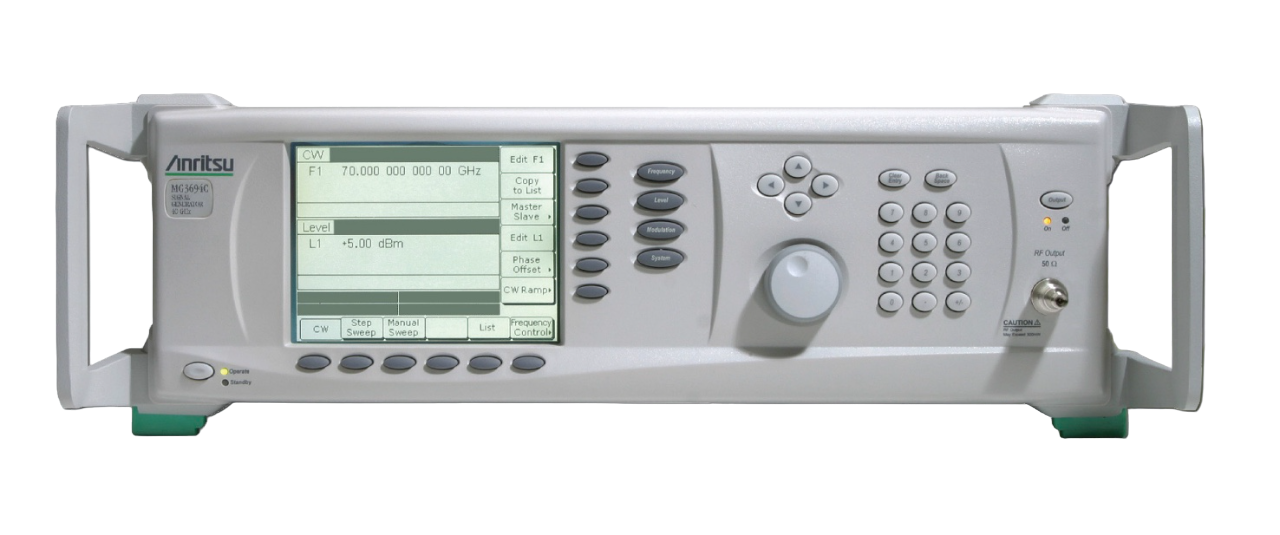 Signal Generator
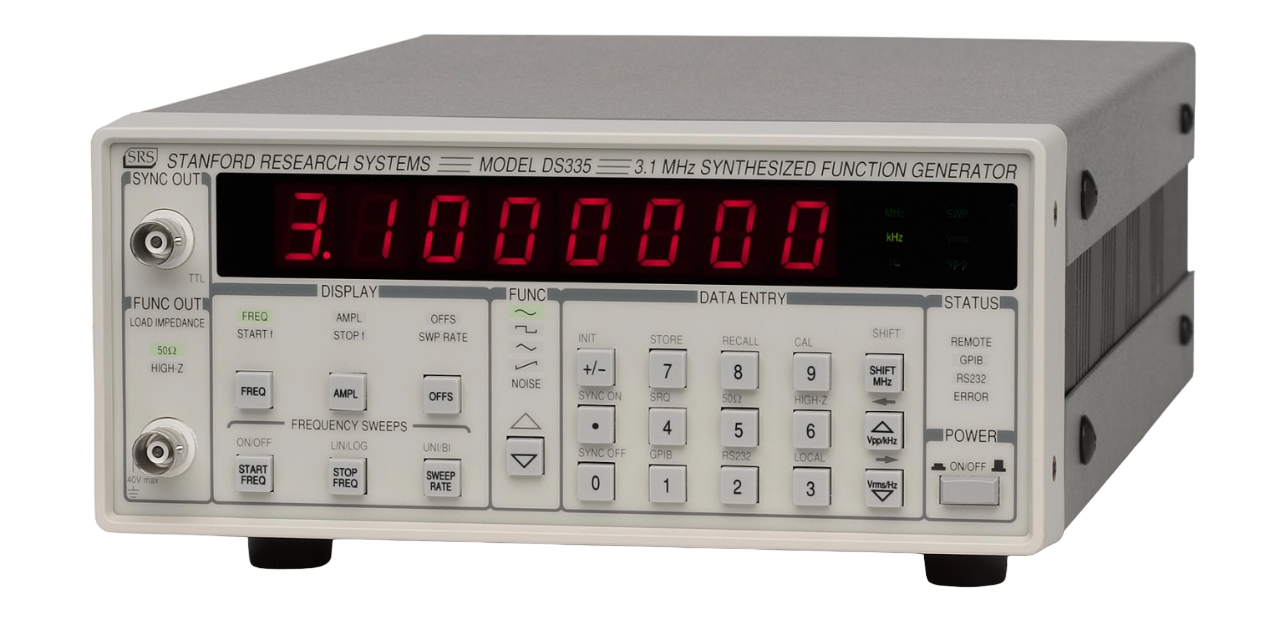 Function Generator
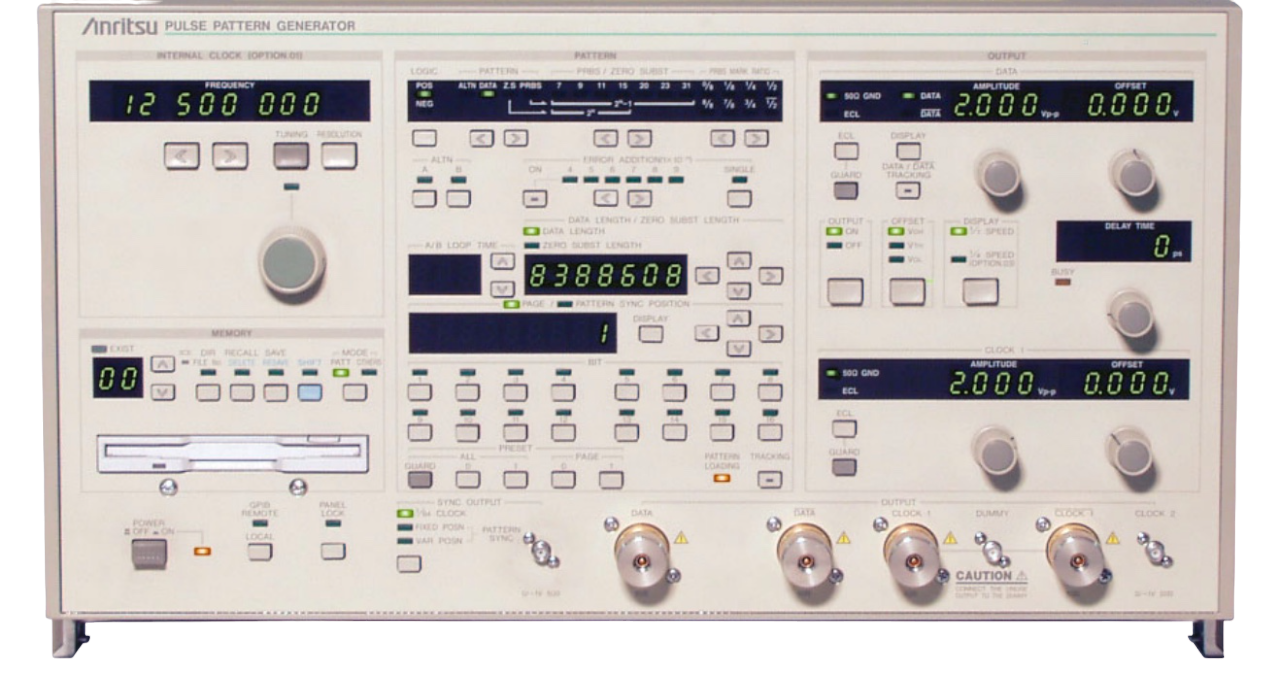 Pulse / Pattern Generator
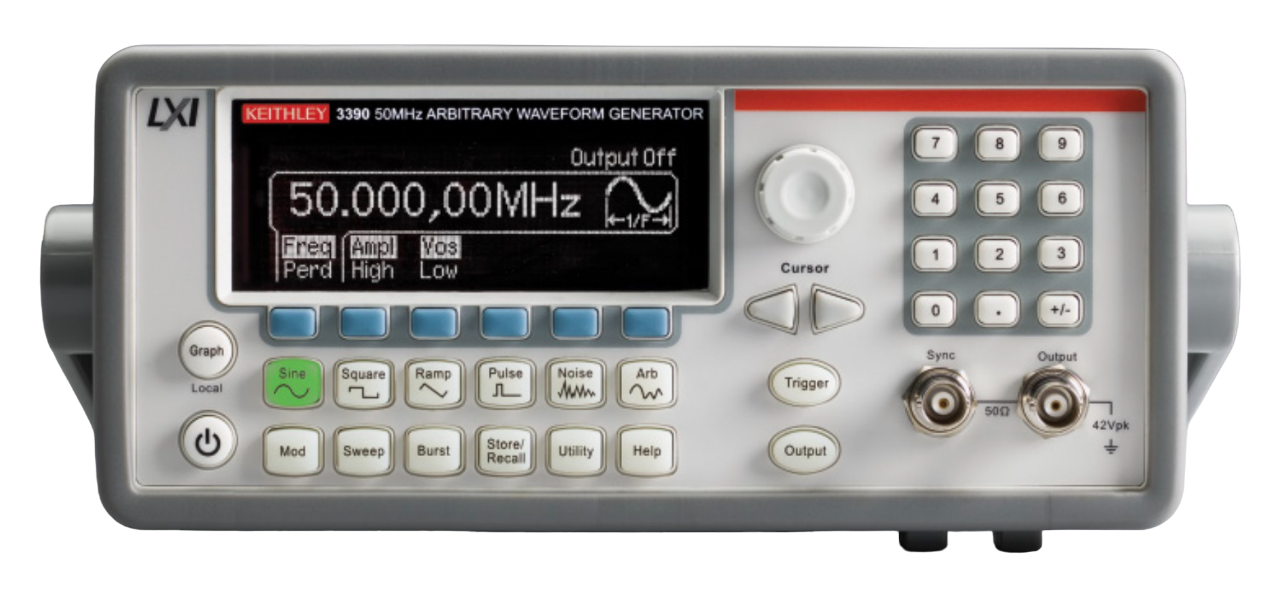 Waveform Generator
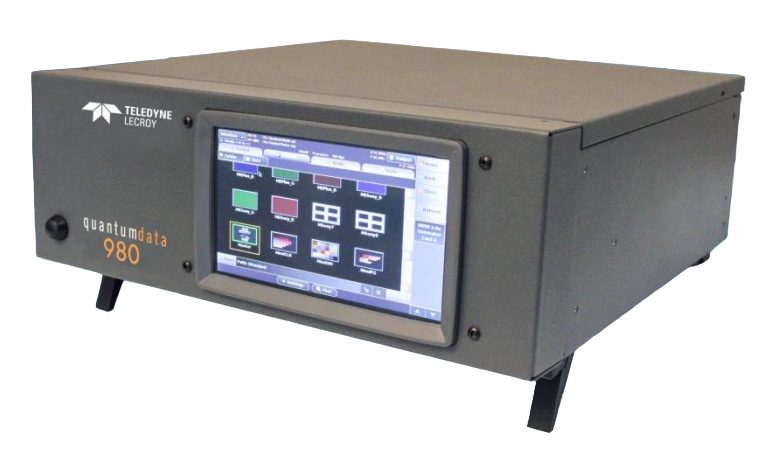 Other Generators
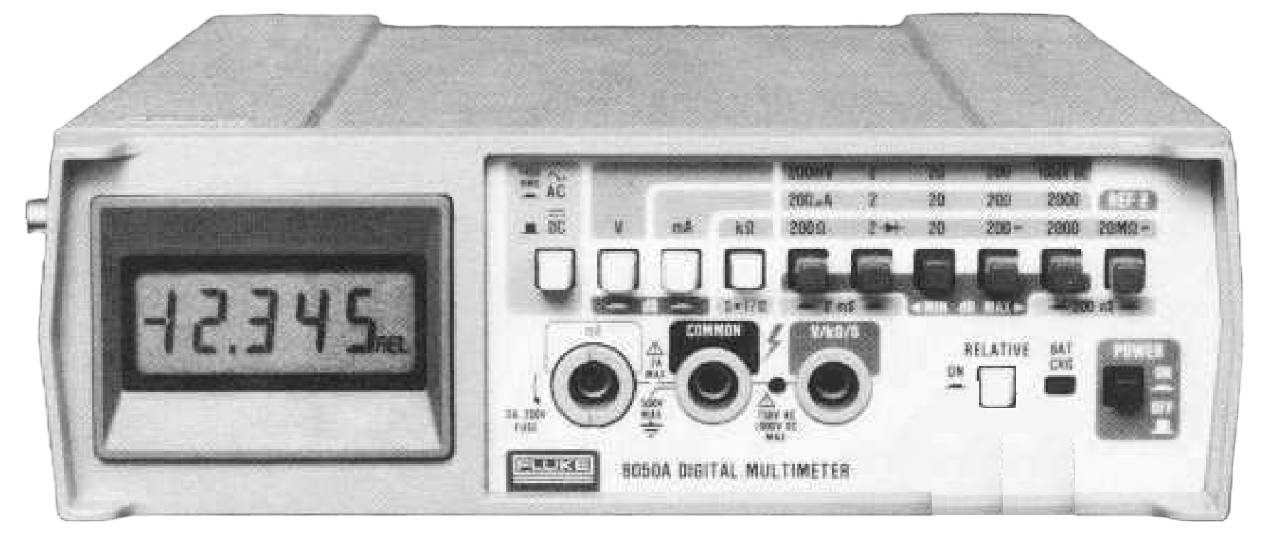 Digital Multimeter
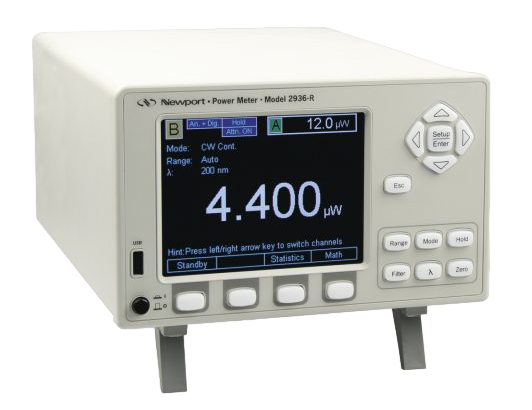 Power Meter
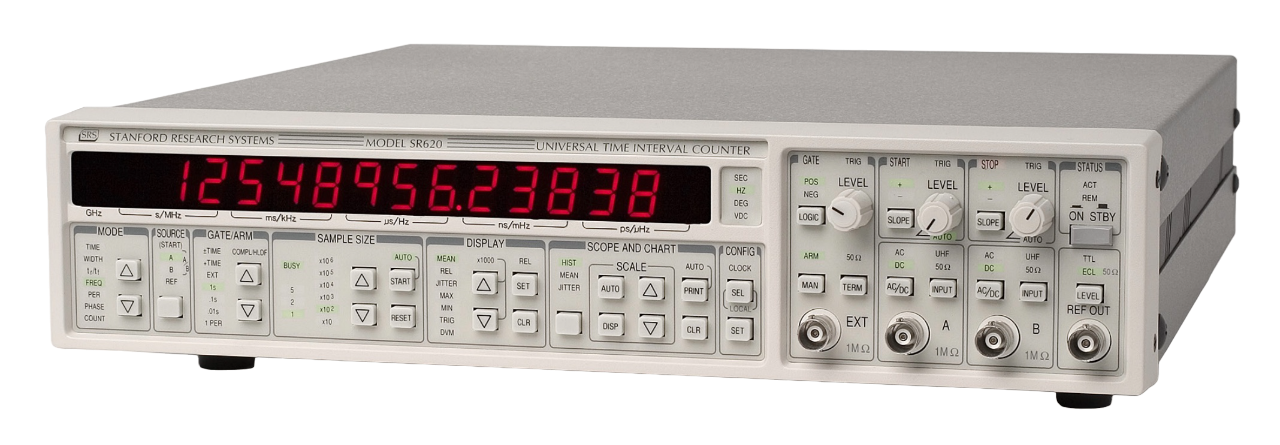 Frequency Counters
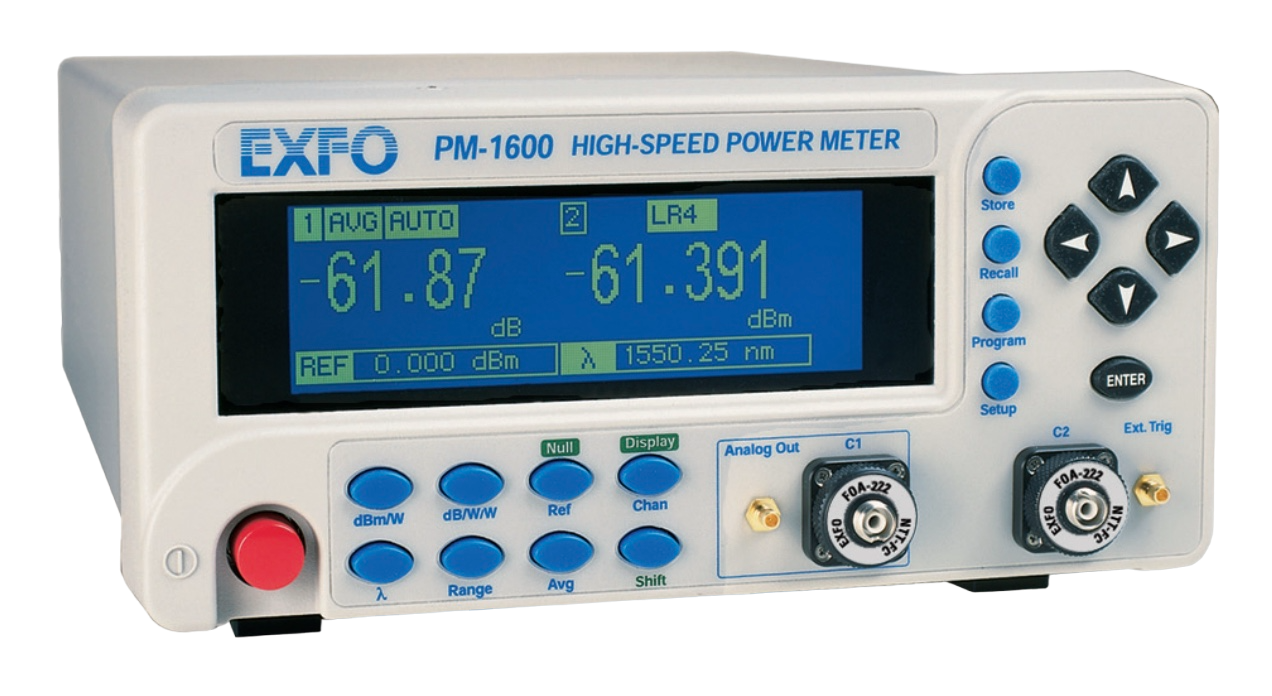 Optical Power Meter
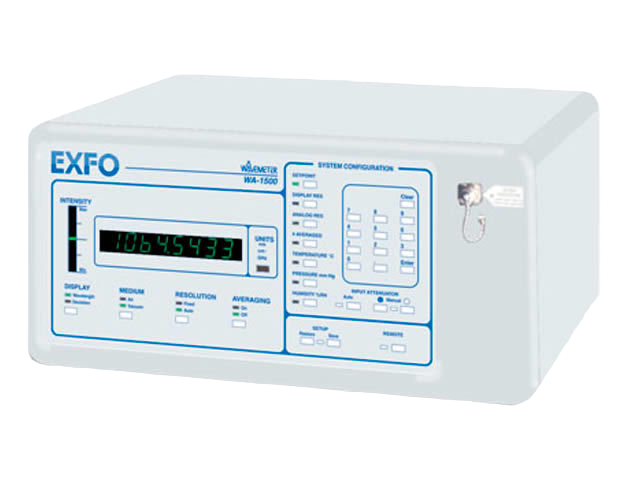 Wavelength Meter
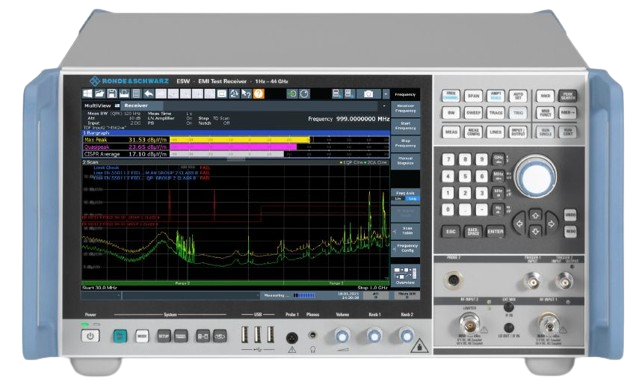 Receiver
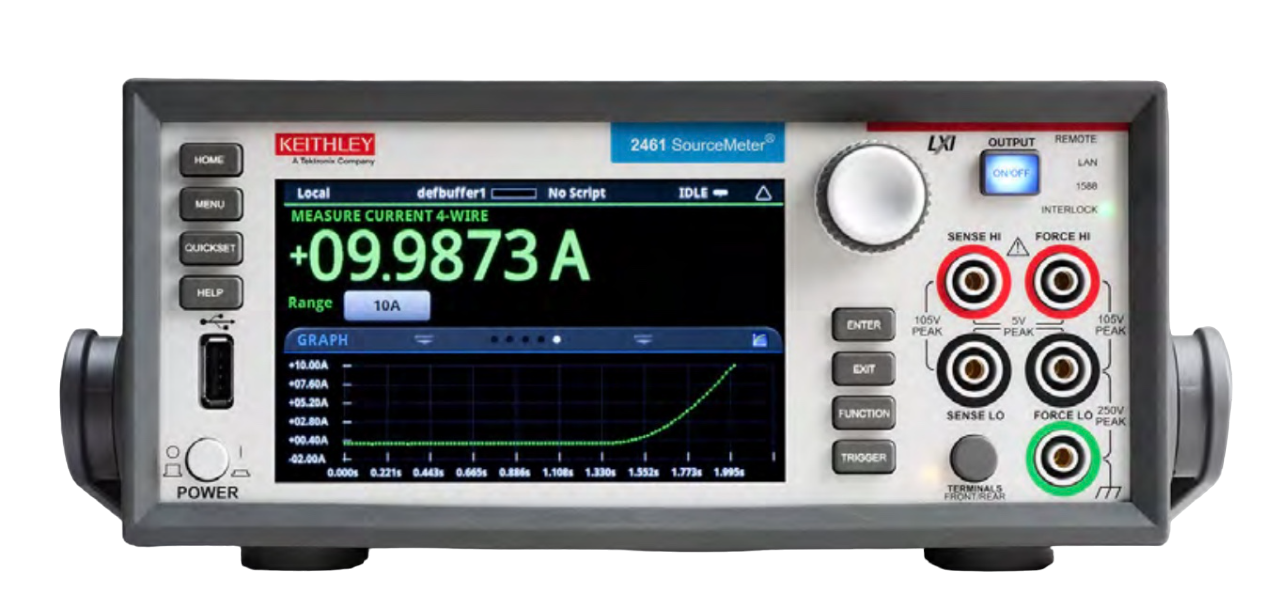 Current/Power Source Meter
 Picoammeter
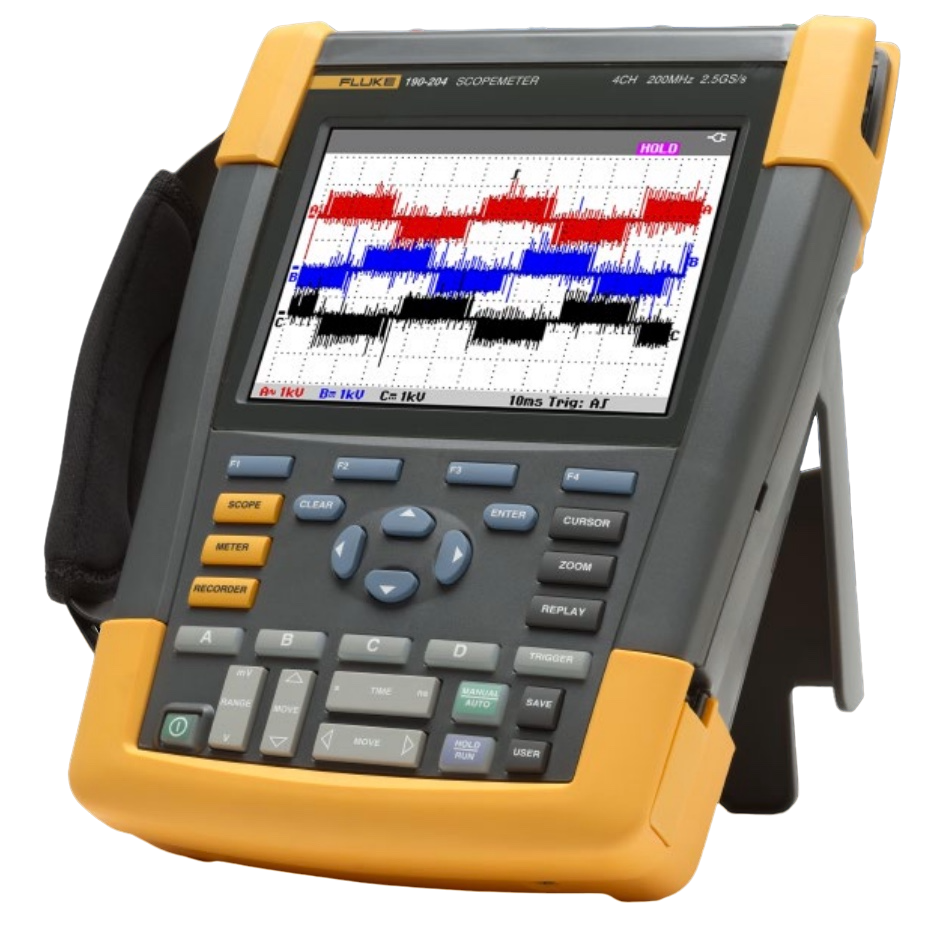 Other Meters
 Optical Fiber
 Fiber Cleaver
 Fusion Splicer
 Fiber Recoater
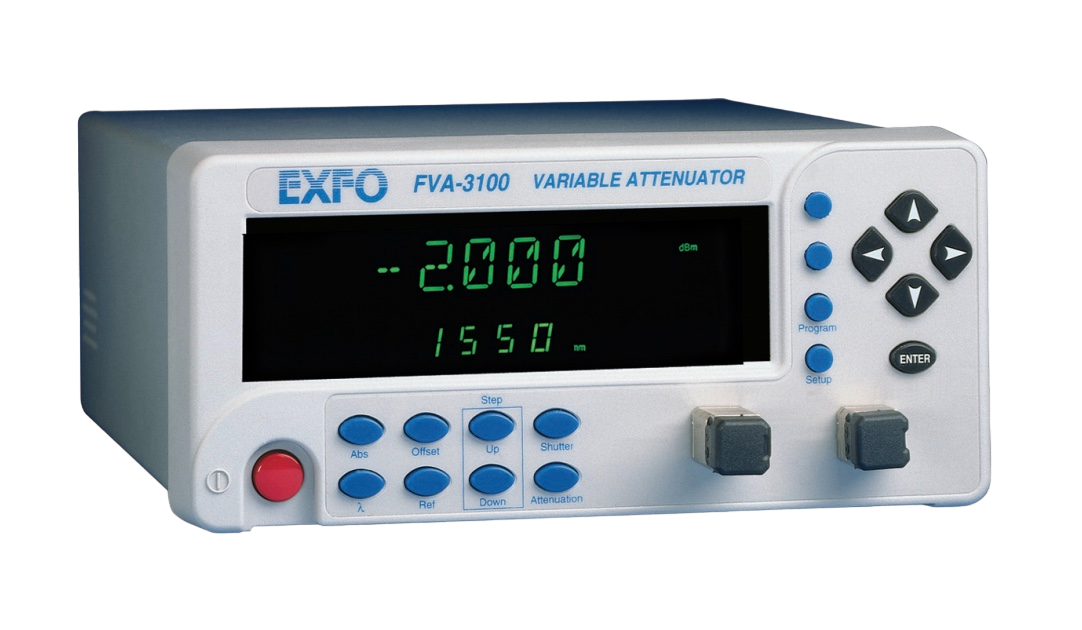 Optical Attenuator
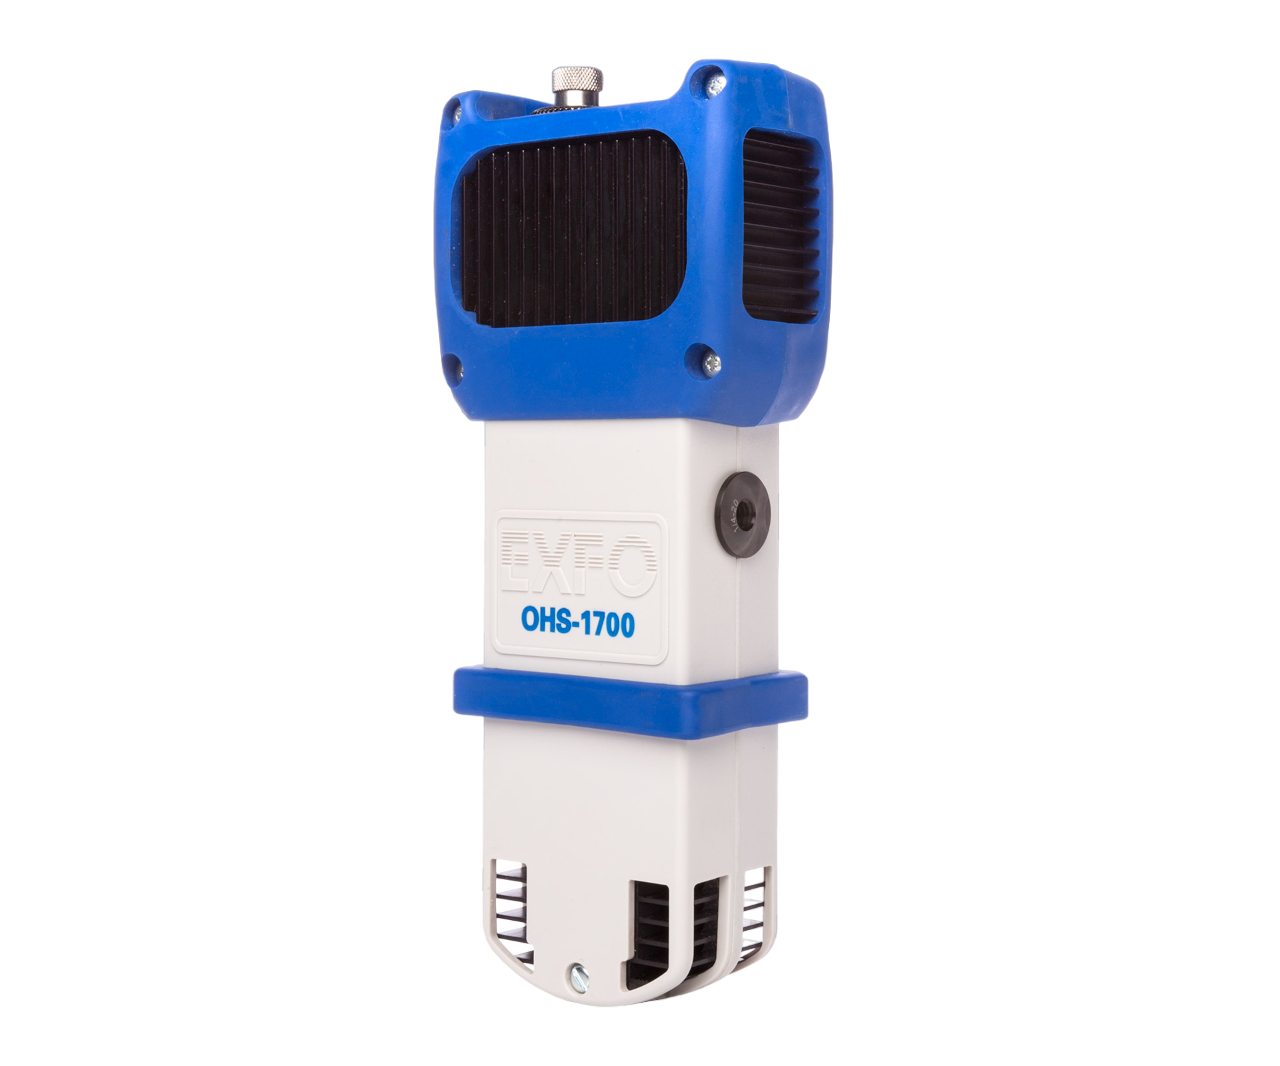 Optical Head
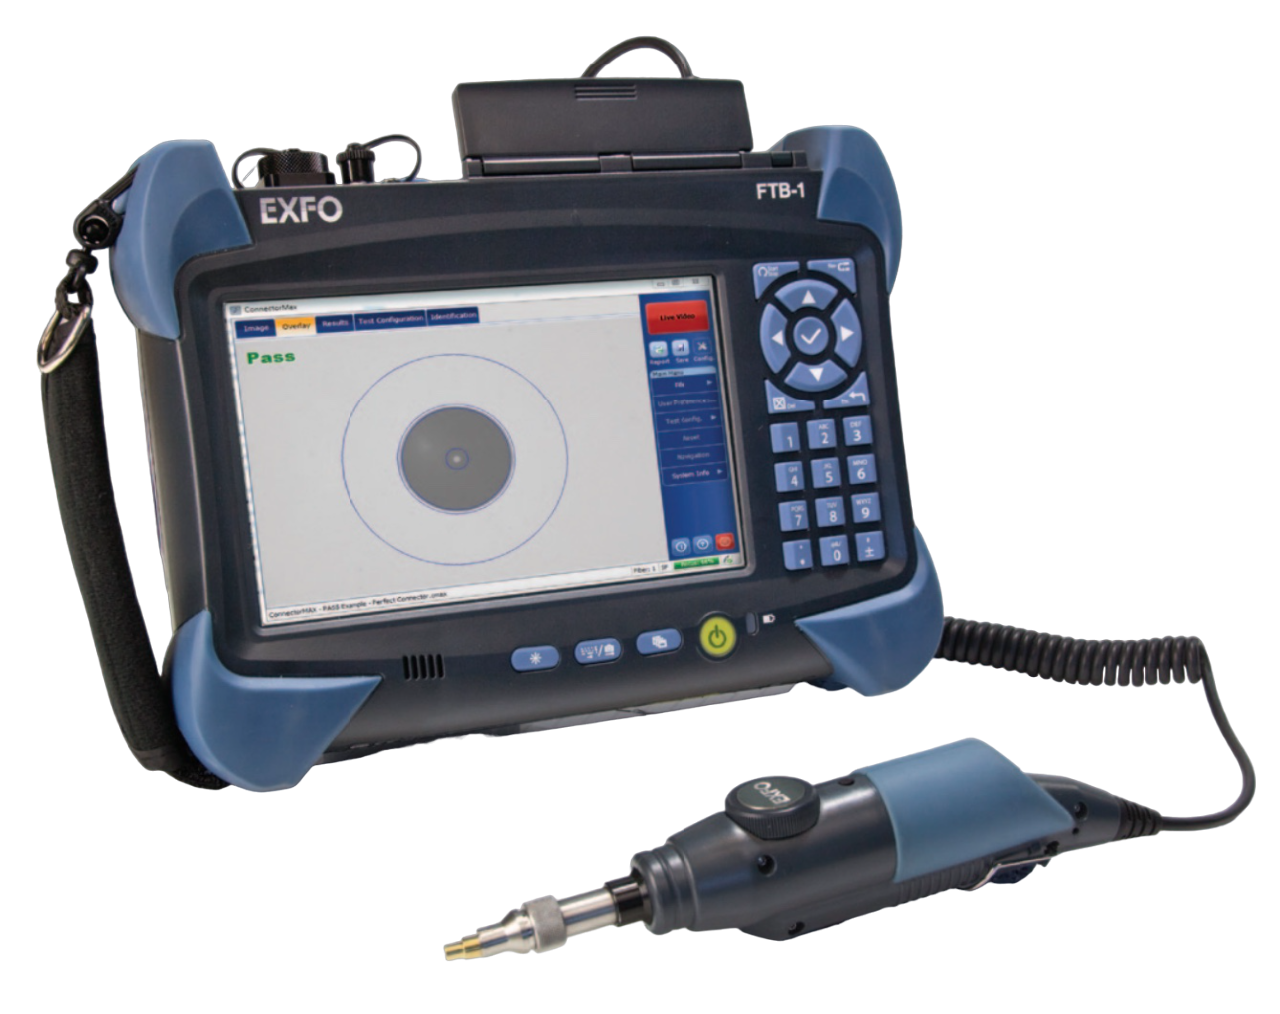 OTDR (Optical Time-Domain Reflectometer)
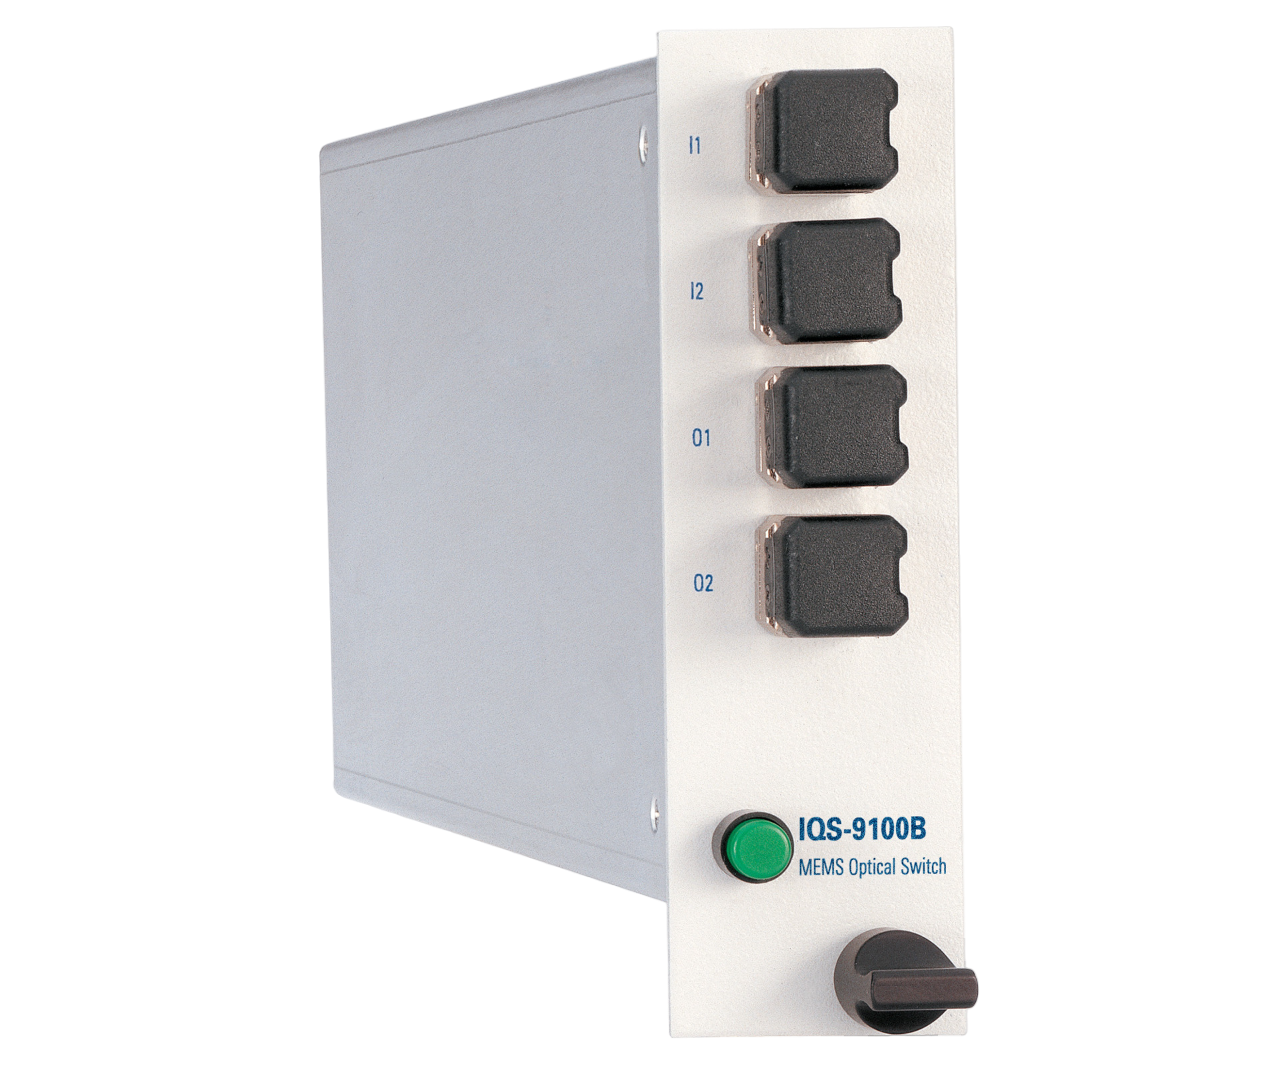 Other Optical Instruments
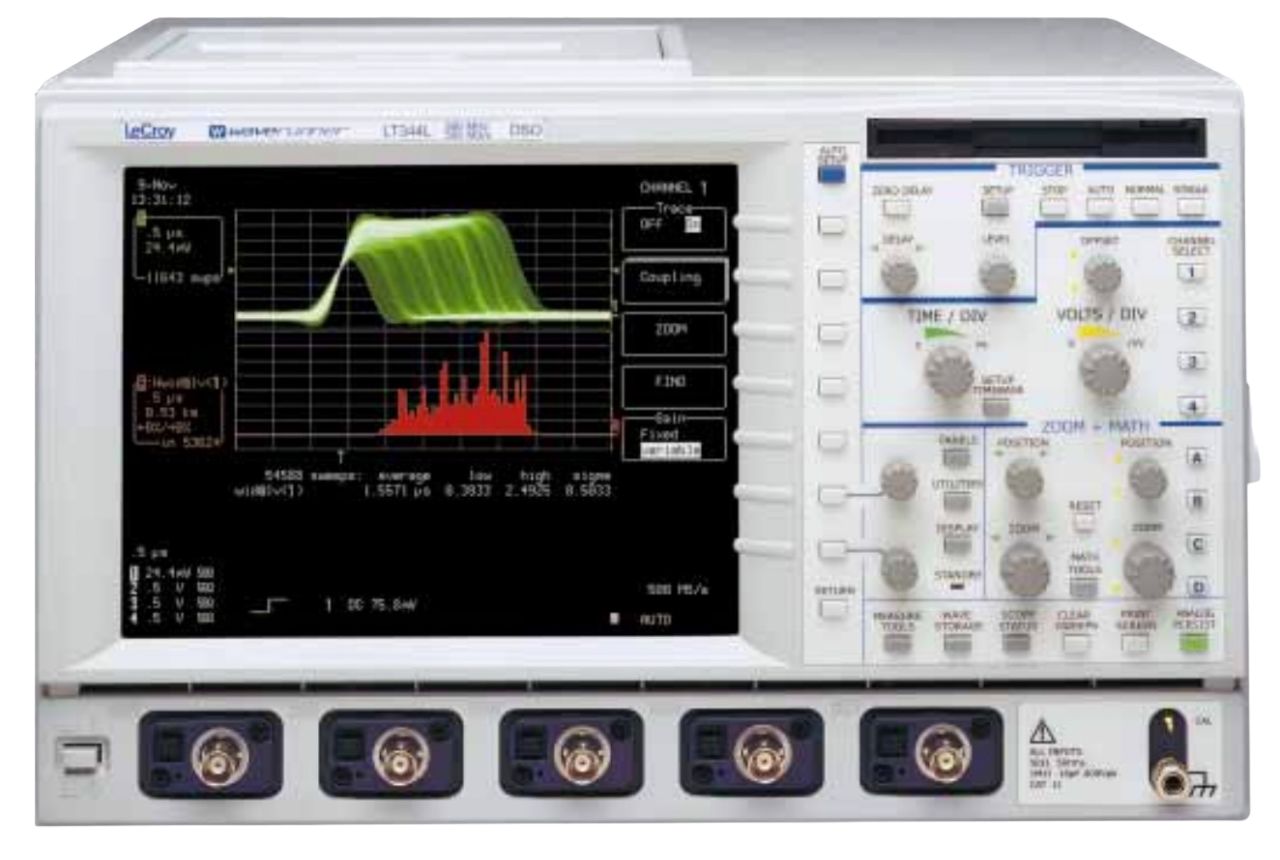 Oscilloscopes
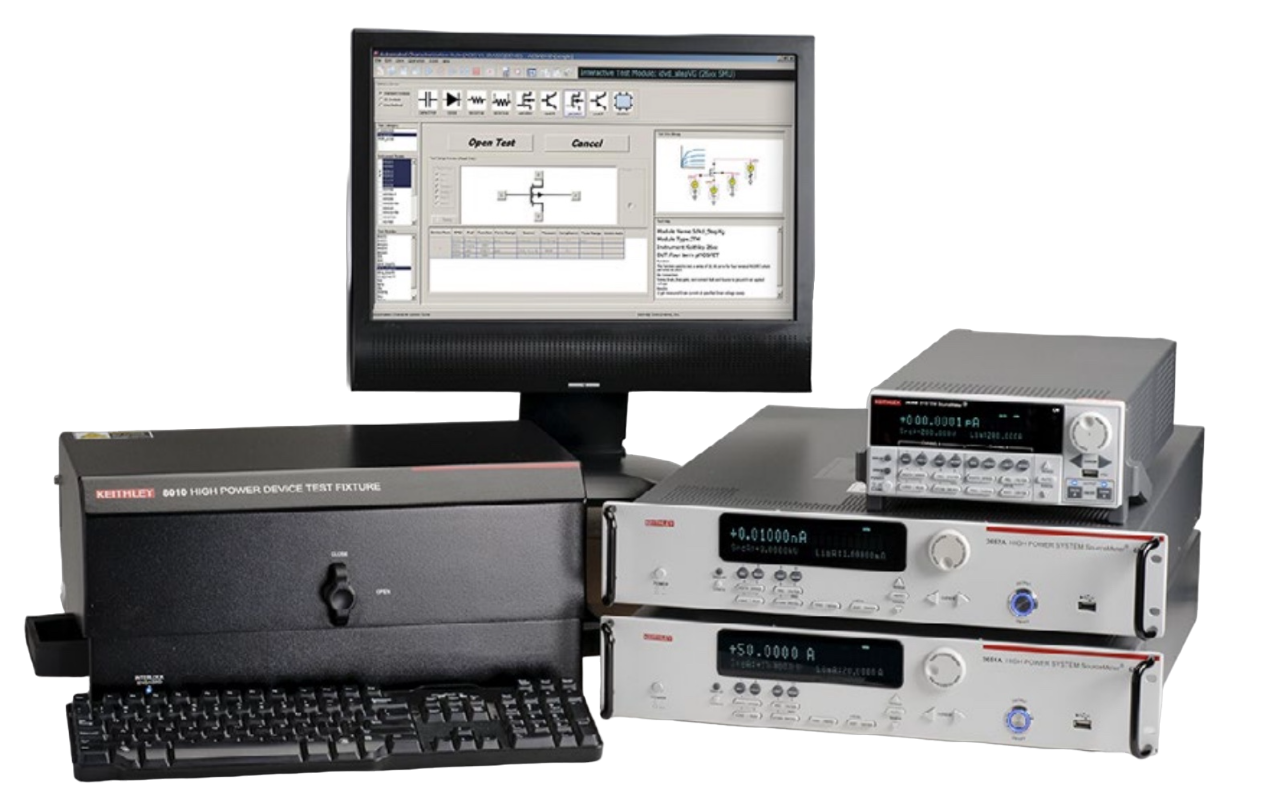 Curve Tracer
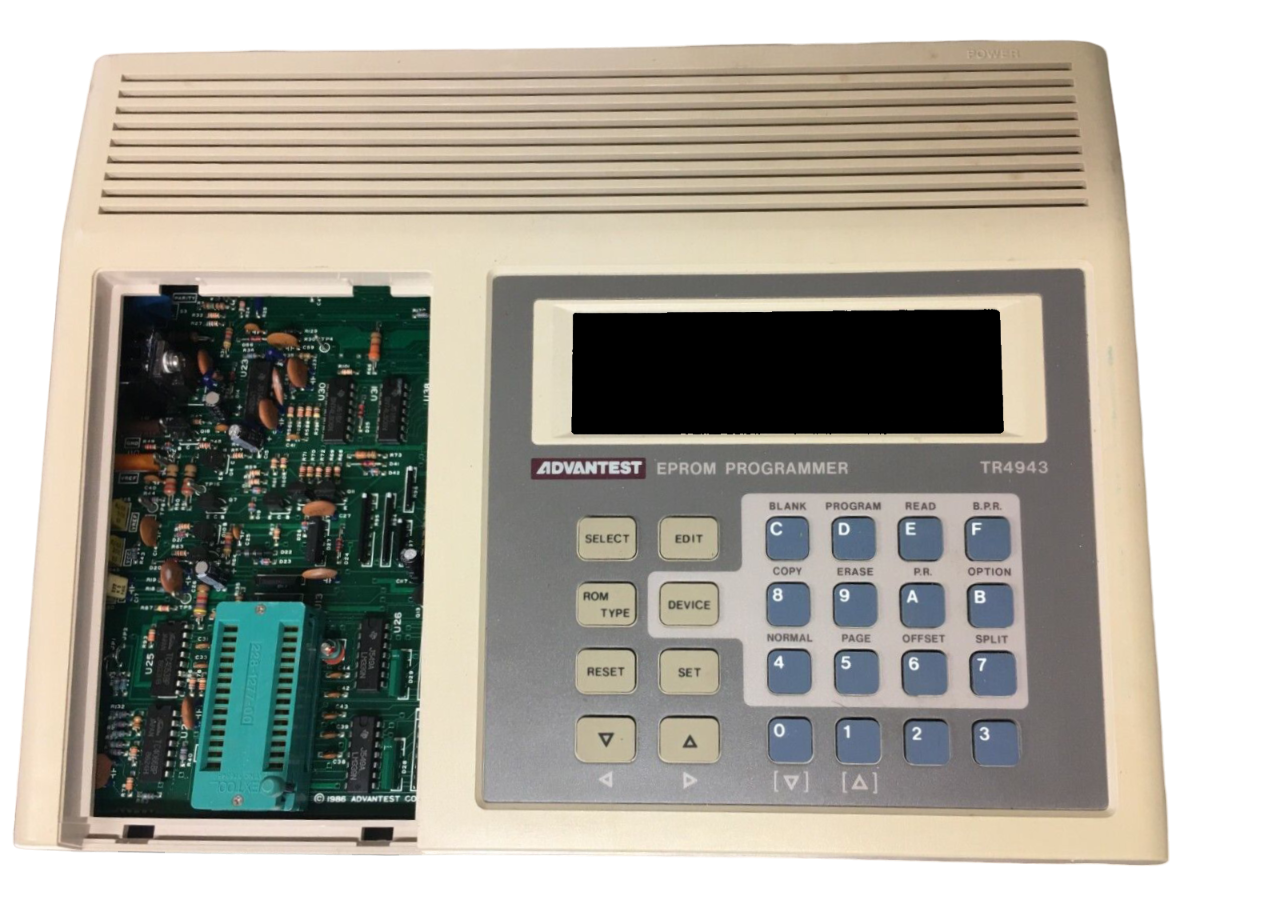 EPROM Programer
 Recorder
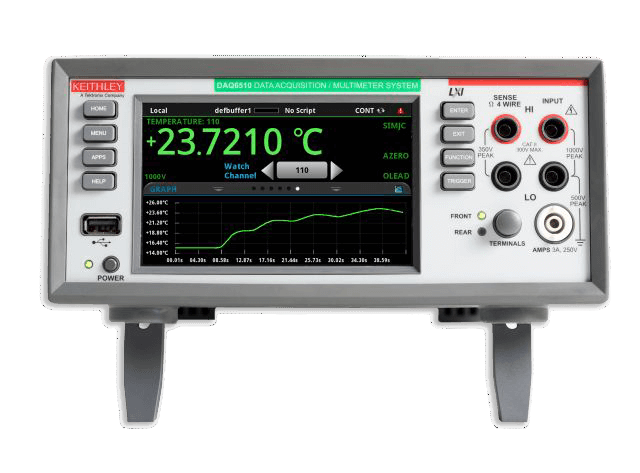 Data Acquisition System
 Data Logger
 Calibration Kit
 Verification Kit
 Test Set
 Test Chamber / Ovens
 Calibrator
 Controller
 Mainframe
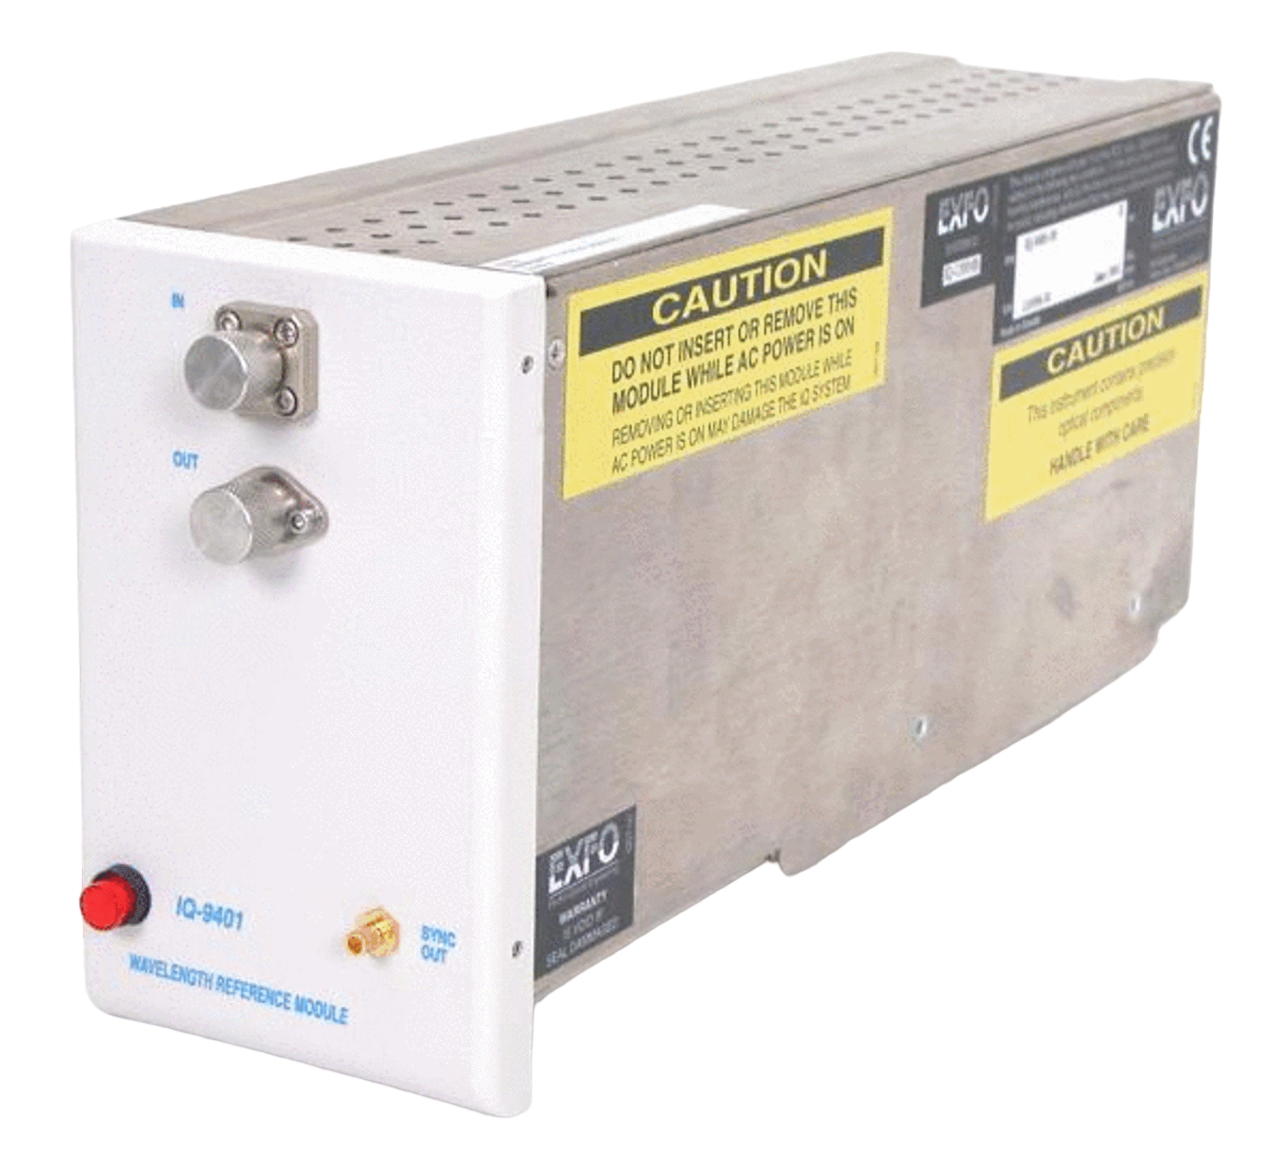 Module
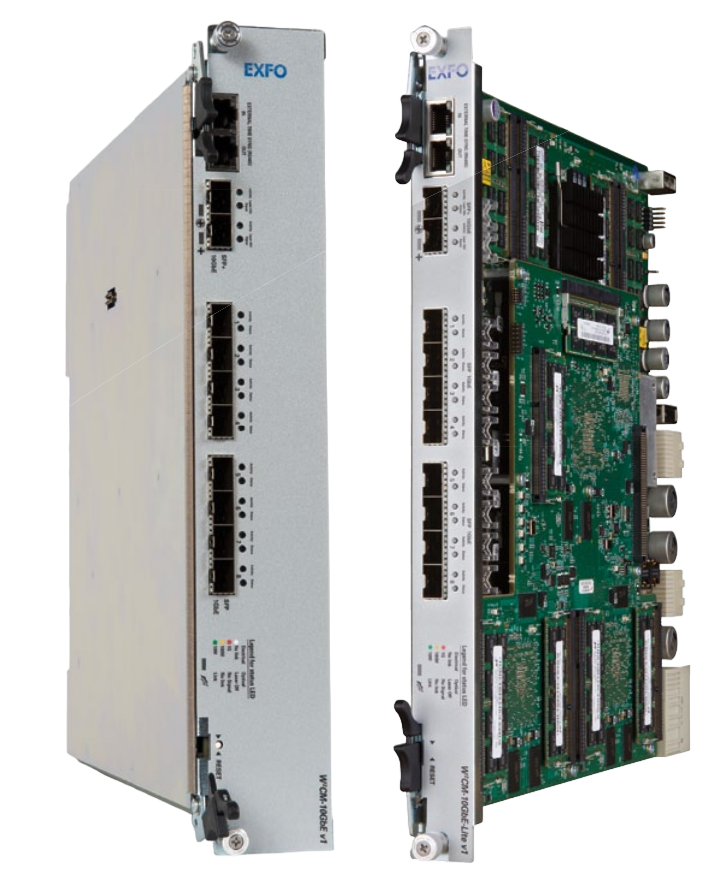 Interfaces(GPIB, Power)
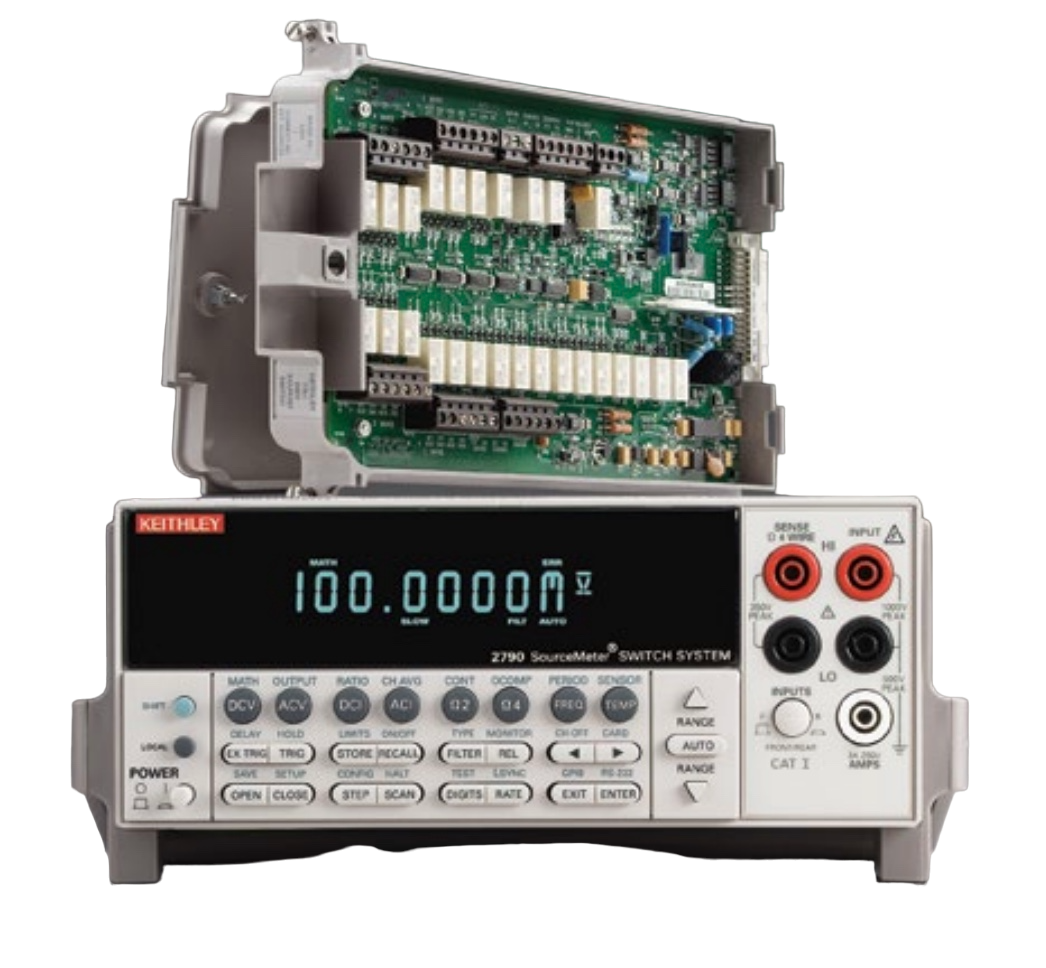 Switch
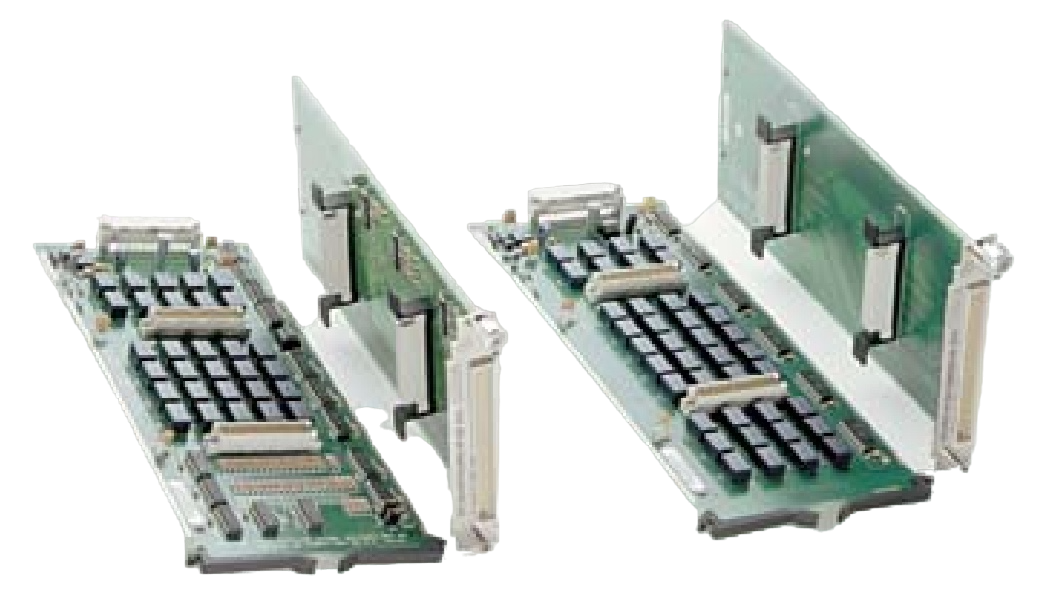 Matrix Cards
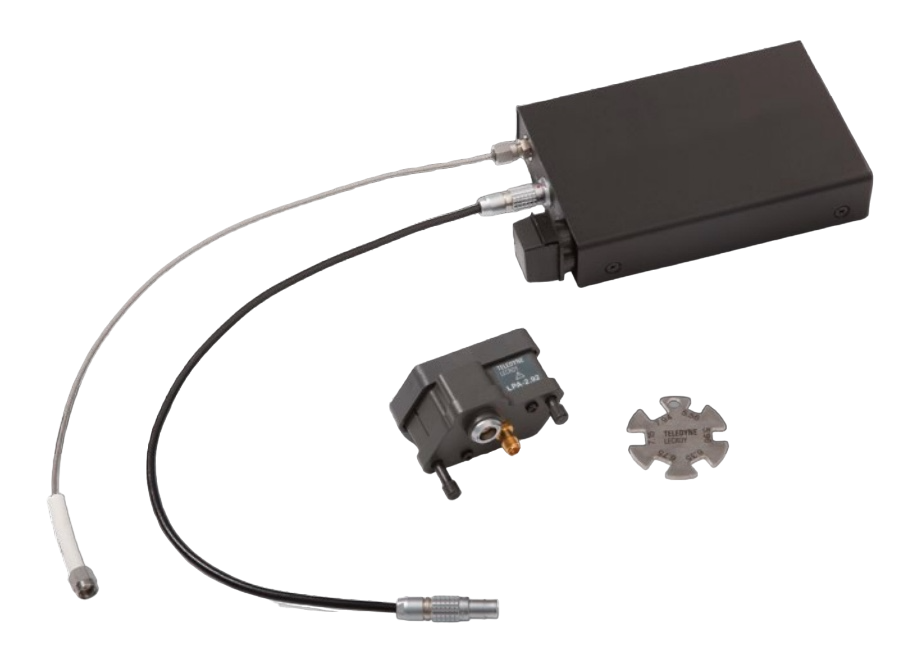 Converter
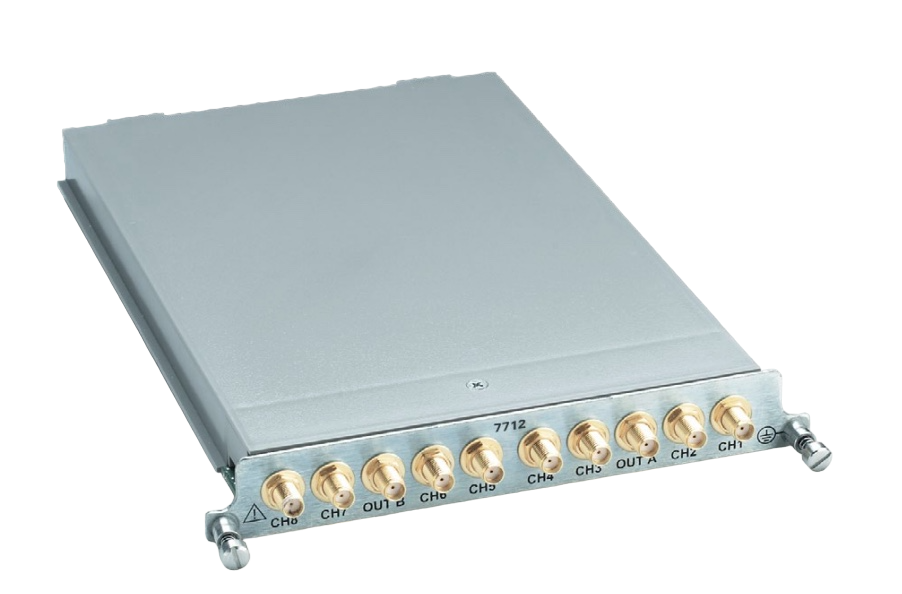 Multiplexer
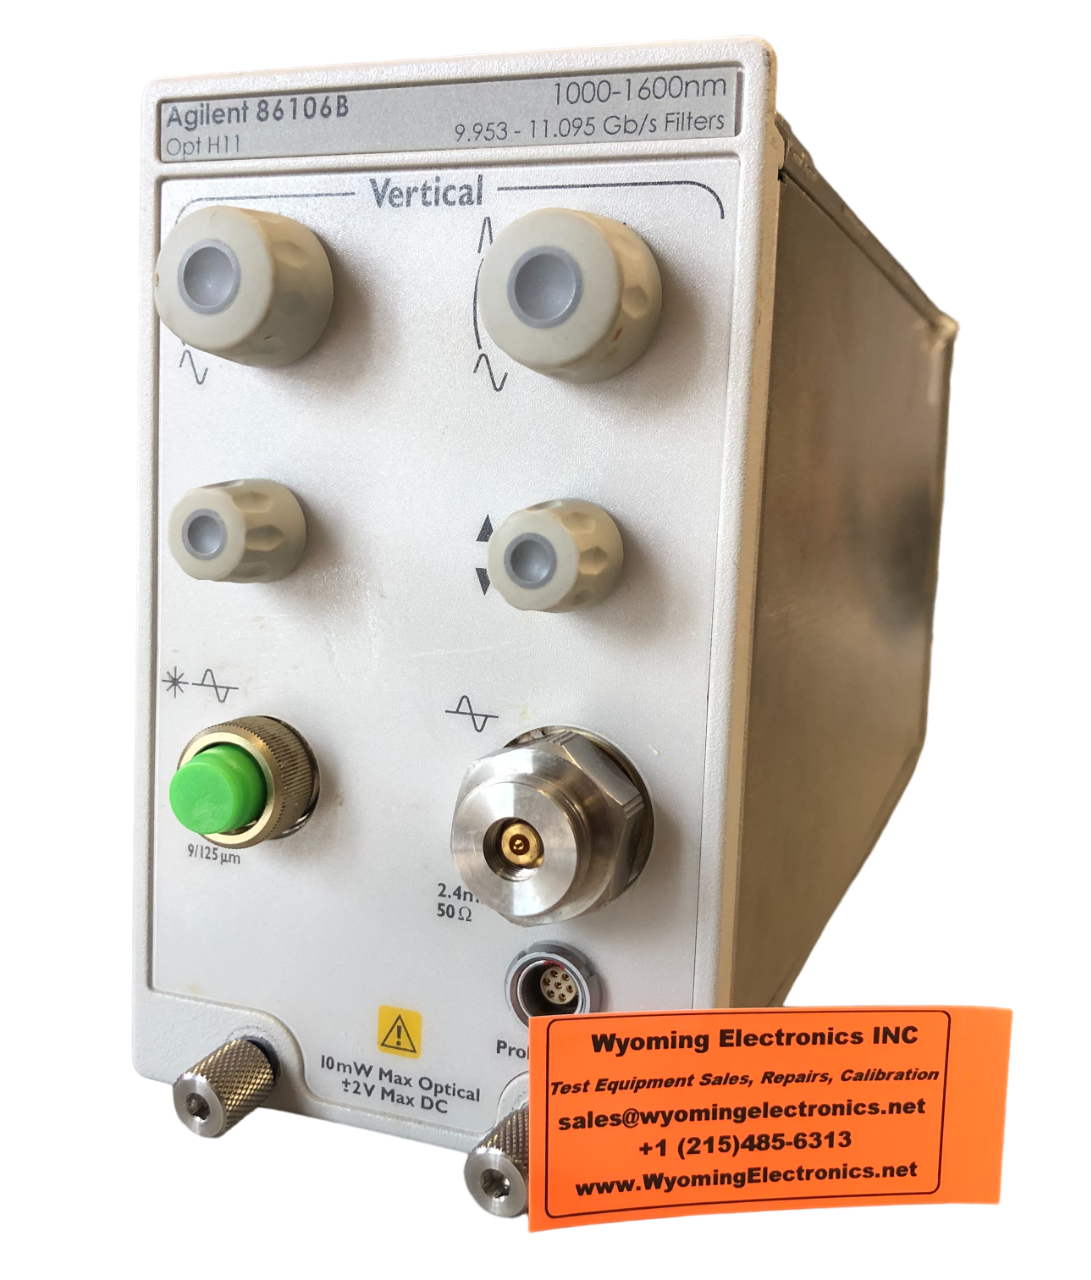 Plug-in
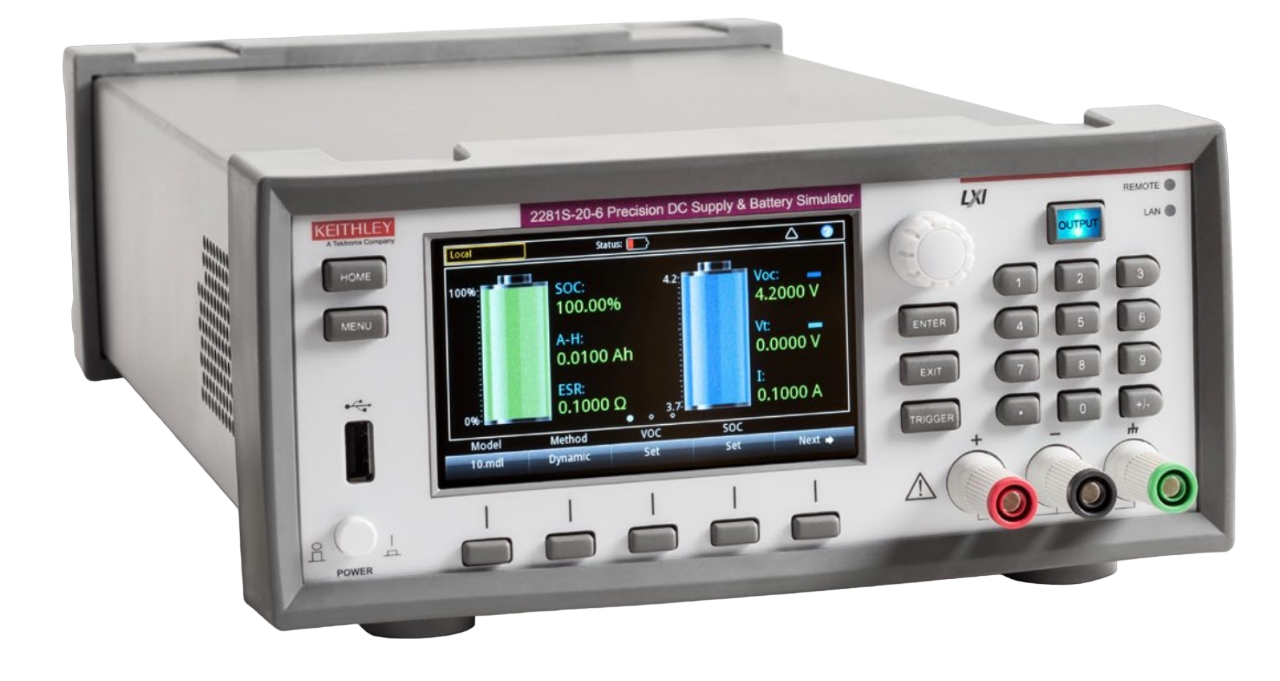 Simulator
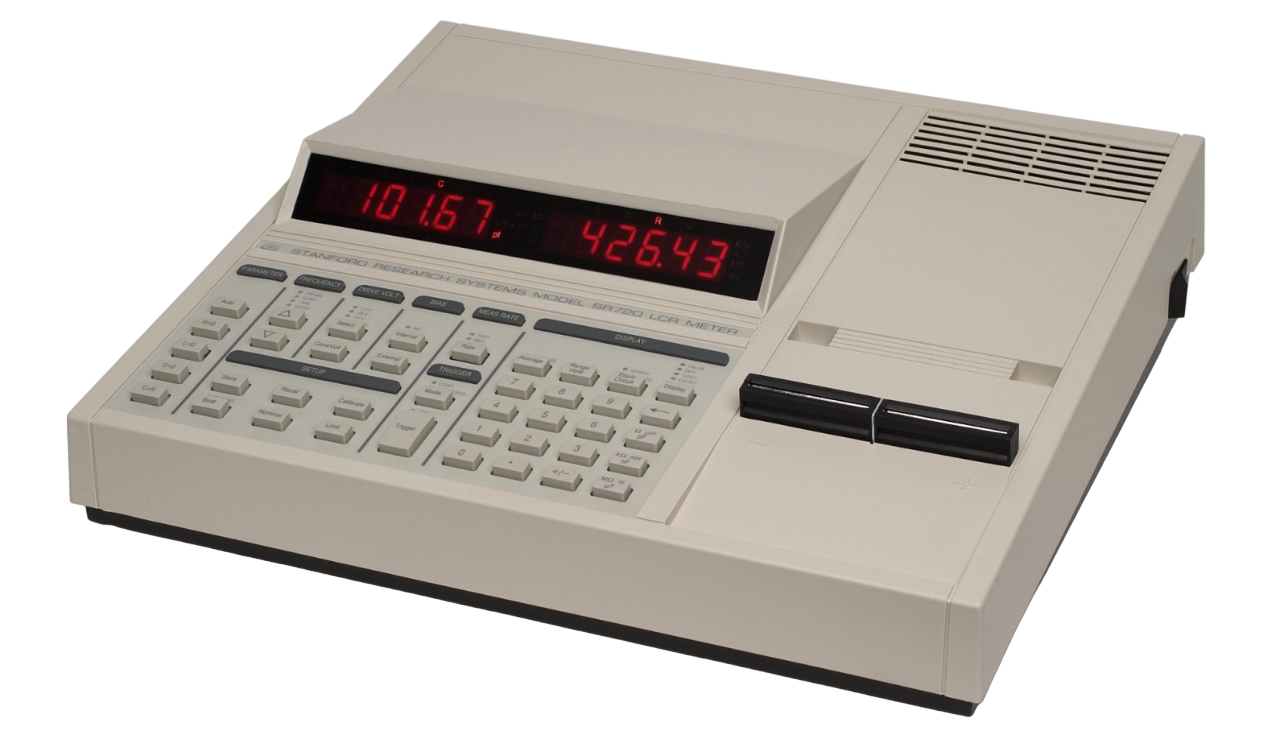 LCR Meters
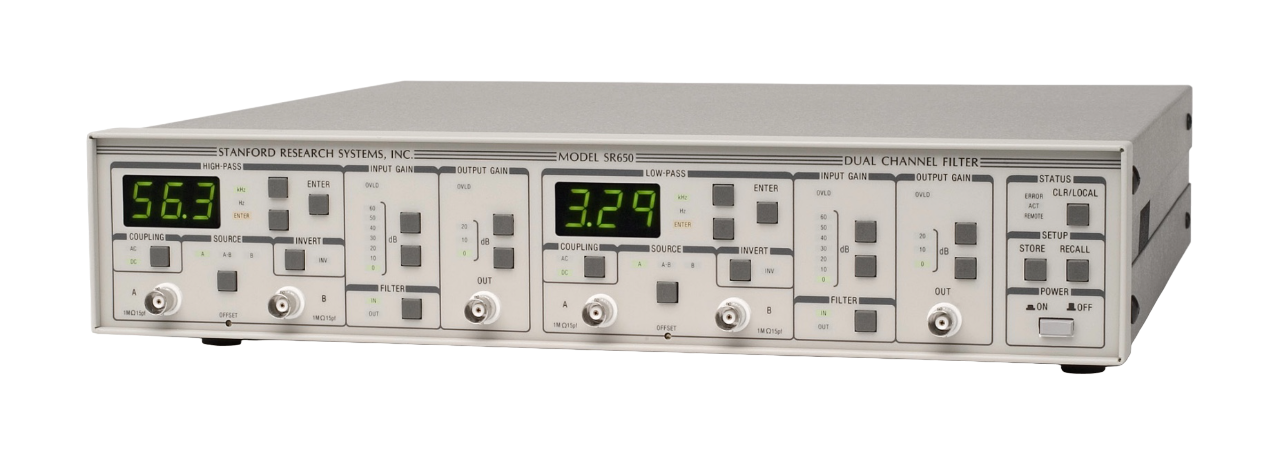 Filters
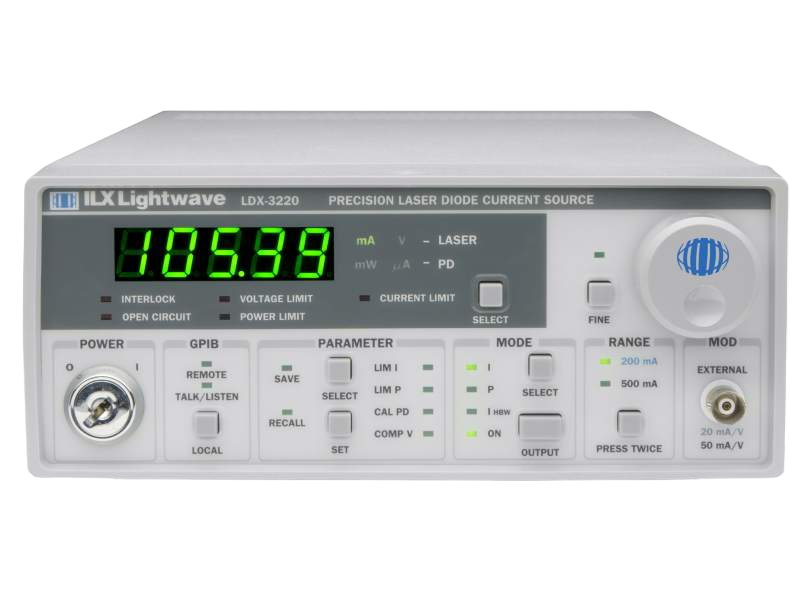 Laser Drivers
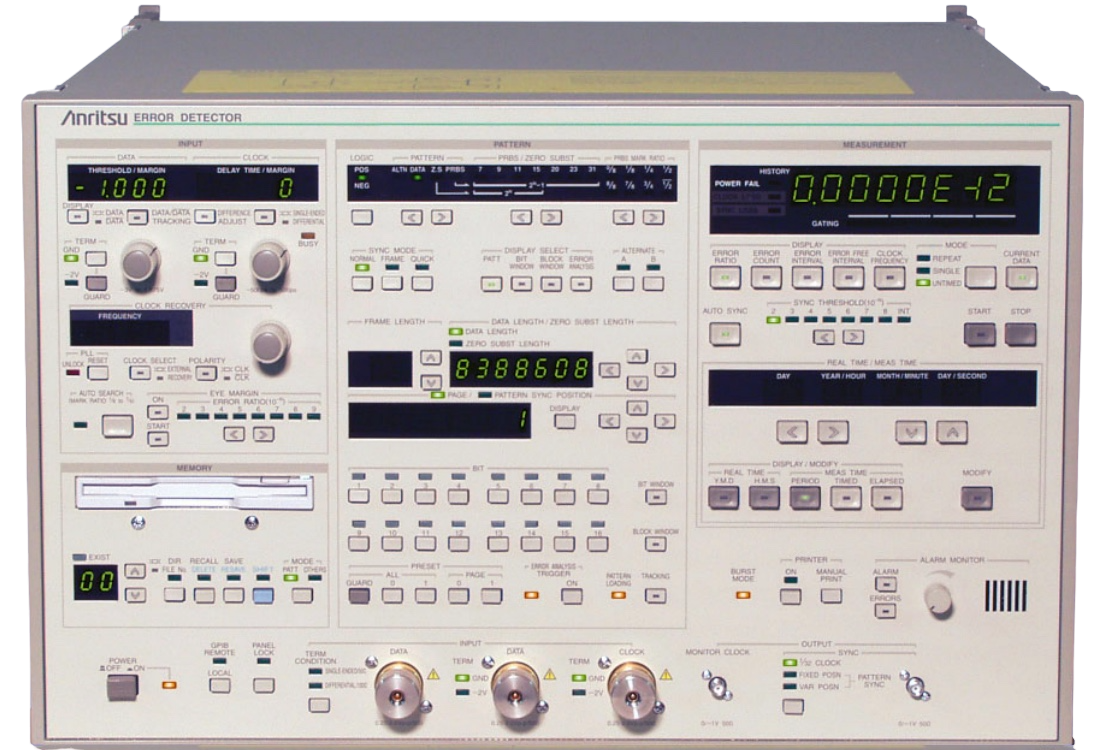 Error Detectors
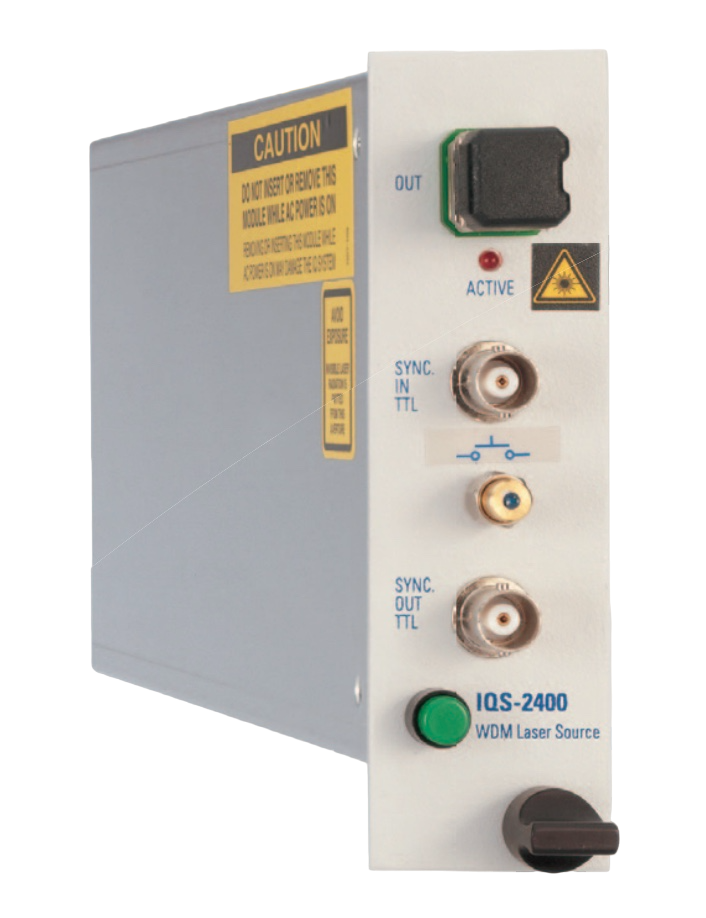 Laser Source
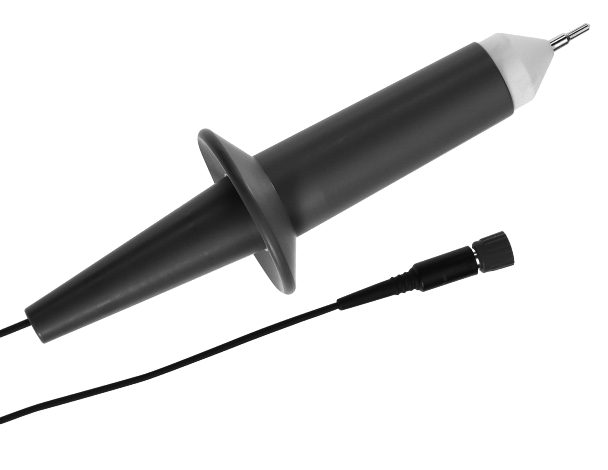 Probe
Probe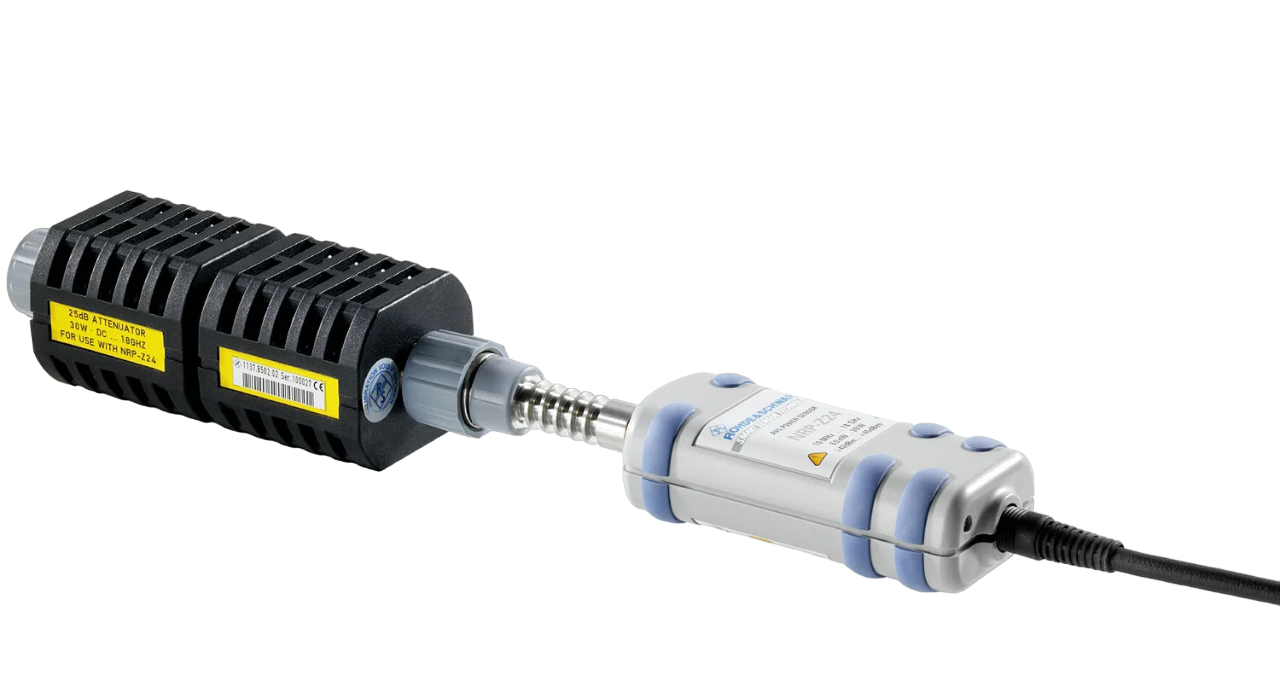 Power Sensor
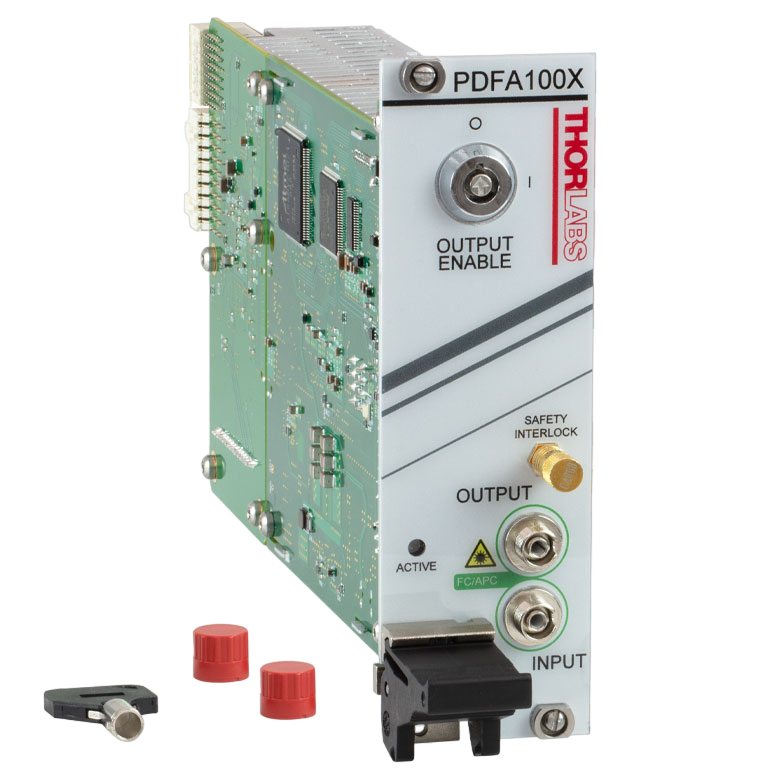 Amplifier
 Attenuator
 Optical Sensor
 Light/LED Source
 Broadband / Noise Source
 Optical / Fiber Source
 Power Supply
 Voltage Source
 Polisher
 Microscope
 Adapter
 Platforms/Mounts
 Bridges
 Connectors & Accessories